Spirit Airlines 2014 Annual Report Download - page 36
Download and view the complete annual report
Please find page 36 of the 2014 Spirit Airlines annual report below. You can navigate through the pages in the report by either clicking on the pages listed below, or by using the keyword search tool below to find specific information within the annual report.-
 1
1 -
2
-
3
-
4
-
5
-
6
-
7
-
8
-
9
-
10
-
11
-
12
-
13
-
14
-
15
-
16
-
17
-
18
-
19
-
20
-
21
-
22
-
23
-
24
-
25
-
 26
26 -
 27
27 -
 28
28 -
 29
29 -
 30
30 -
 31
31 -
 32
32 -
 33
33 -
 34
34 -
 35
35 -
 36
36 -
 37
37 -
 38
38 -
 39
39 -
 40
40 -
 41
41 -
 42
42 -
 43
43 -
 44
44 -
 45
45 -
 46
46 -
47
-
48
-
49
-
50
-
51
-
52
-
53
-
54
-
55
-
56
-
57
-
58
-
59
-
60
-
61
-
62
-
63
-
64
-
65
-
66
-
67
-
68
-
69
-
70
-
71
-
72
-
73
-
74
-
75
-
76
-
77
-
78
-
79
-
80
-
81
-
82
-
83
-
84
-
85
-
86
-
87
-
88
-
89
-
90
-
91
-
92
-
93
-
94
-
95
-
96
-
97
-
98
-
99
 |
 |
36
ITEM 7. MANAGEMENT’S DISCUSSION AND ANALYSIS OF FINANCIAL CONDITION AND RESULTS OF
OPERATIONS
You should read the following discussion of our financial condition and results of operations in conjunction with the financial
statements and the notes thereto included elsewhere in this annual report.
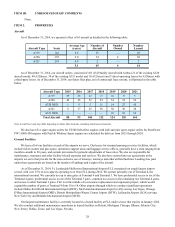
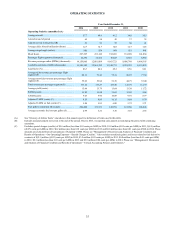
2014 Year in Review
The year 2014 marks the eighth consecutive year of profitability for us. We achieved a net income of $225.5 million
($3.08 per share, diluted), compared to a net income of $176.9 million ($2.42 per share, diluted) in 2013. The increase in our
net income was a result of our increased capacity, lower fuel cost as well as continued focus on low costs which help maintain
our high profit margins.
For the year ended December 31, 2014, we achieved an operating profit margin of 18.4%, the highest in our history,
on $1,931.6 million in operating revenues. Our traffic grew by 18.0% as we continued to stimulate demand with ultra-low
fares. Total revenue per passenger flight segment increased by 1.4% from $133.27 to $135.14. Total RASM for 2014 was 11.82
cents, a decrease of 1.0% compared to the prior year period, driven by lower operating yields on relatively stable load factors
year over year.
Our operating cost structure is a primary area of focus and is at the core of our ULCC business model in which we
compete solely on the basis of price. Our unit operating costs continue to be among the lowest of any airline in the Americas.
During 2014, we increased our capacity by 17.9% as we grew our fleet of Airbus single-aisle aircraft from 54 to 65 aircraft,
including purchased aircraft for the first time in our history. We launched service to 23 new markets in 2014 and added one new
destination: Kansas City.
During 2014, we increased our average non-ticket revenue per passenger flight segment by 2.2%, or $1.19, to $55.03.
Our total non-ticket revenue increased by 17.7%, or $118.2 million, to $786.6 million in 2014. The year-over-year increase in
average non-ticket revenue per passenger flight segment was primarily driven by a higher volume of passengers electing to
purchase seat assignments, largely due to a software update completed in 2014 that enables us to sell seat assignments through
more channels as well as a more rigorous approach to managing our seat inventory. Additionally, in July 2013, we increased
our passenger usage fee (PUF), helping to drive the increase in PUF fees year over year.
During 2014, our adjusted CASM ex-fuel decreased by 0.5% to 5.88 cents. The decrease was primarily due to lower
passenger re-accommodation expense year over year, due to better operational performance during 2014, as compared to 2013.
We improved on-time performance year over year and maintained one of the highest completion factors in the industry. In
addition, on a per ASM basis, distribution expense decreased, primarily due to a $2.9 million settlement gain received in 2014,
and aircraft rent expense decreased due to reduced rent expense related to 14 A319 aircraft for which lease extensions with
reduced rates were negotiated with the lessor at the end of the second quarter of 2013, providing for a full year of benefit in
2014 versus 2013. This decrease was partially offset by an increase in depreciation and amortization expense, landing fees and
other rents expense, salaries, wages and benefits expense, and maintenance, materials and repairs expense per ASM.
During 2014, we grew our aicraft fleet by 20.4% and we took delivery of purchased aircraft for the first time in our history.
As of December 31, 2014, our 65 Airbus A320-family aircraft fleet was comprised of 29 A319s, 34 A320s and 2 A321s, of
which 4 are owned and 61 are financed under operating leases. As of December 31, 2014, our aircraft orders consisted of 101
A320 family aircraft with Airbus and 5 direct operating leases for A320neos with a third party, scheduled for delivery from
2015 through 2021. Our plan calls for growing the fleet by 23.1% in 2015.
Operating Revenues
Our operating revenues are comprised of passenger revenues and non-ticket revenues.
Passenger Revenues. Passenger revenues consist of the base fares that customers pay for air travel.
Non-ticket Revenues. Non-ticket revenues are generated from air travel-related charges for baggage, passenger usage fee
(PUF) for bookings through certain of our distribution channels, advance seat selection, itinerary changes, hotel travel packages
and loyalty programs such as our FREE SPIRIT affinity credit card program and $9 Fare Club. Non-ticket revenues also
include revenues derived from services not directly related to providing transportation such as the sale of advertising to third
parties on our website and on board our aircraft.