Spirit Airlines 2014 Annual Report Download - page 44
Download and view the complete annual report
Please find page 44 of the 2014 Spirit Airlines annual report below. You can navigate through the pages in the report by either clicking on the pages listed below, or by using the keyword search tool below to find specific information within the annual report.-
 1
1 -
2
-
3
-
4
-
5
-
6
-
7
-
8
-
9
-
10
-
11
-
12
-
13
-
14
-
15
-
16
-
17
-
18
-
19
-
20
-
21
-
22
-
23
-
24
-
25
-
26
-
27
-
28
-
29
-
30
-
31
-
32
-
33
-
 34
34 -
 35
35 -
 36
36 -
 37
37 -
 38
38 -
 39
39 -
 40
40 -
 41
41 -
 42
42 -
 43
43 -
 44
44 -
 45
45 -
 46
46 -
 47
47 -
 48
48 -
 49
49 -
 50
50 -
 51
51 -
 52
52 -
 53
53 -
 54
54 -
55
-
56
-
57
-
58
-
59
-
60
-
61
-
62
-
63
-
64
-
65
-
66
-
67
-
68
-
69
-
70
-
71
-
72
-
73
-
74
-
75
-
76
-
77
-
78
-
79
-
80
-
81
-
82
-
83
-
84
-
85
-
86
-
87
-
88
-
89
-
90
-
91
-
92
-
93
-
94
-
95
-
96
-
97
-
98
-
99
 |
 |

44
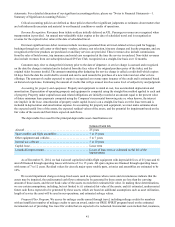
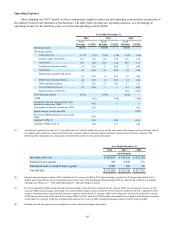
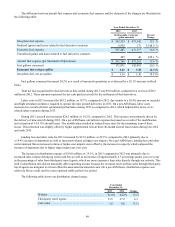
Operating Revenues
Year Ended
2014 % change 2014
versus 2013 Year Ended
2013 % change 2013
versus 2012 Year Ended
2012
Passenger. . . . . . . . . . . . . . . . . . . . . . . . . . . . . . . . . . . . . . $ 1,144,972 16.1% $ 986,018 26.0% $ 782,792
Non-ticket . . . . . . . . . . . . . . . . . . . . . . . . . . . . . . . . . . . . . 786,608 17.7% 668,367 24.8% 535,596
Total operating revenue. . . . . . . . . . . . . . . . . . . . . . . . . . . $ 1,931,580 16.8% $ 1,654,385 25.5% $ 1,318,388
RASM (cents) . . . . . . . . . . . . . . . . . . . . . . . . . . . . . . . . . . 11.82 (1.0)% 11.94 2.8% 11.62
Average ticket revenue per passenger flight segment. . . . $ 80.11 0.9% $ 79.43 5.8% $ 75.11
Average non-ticket revenue per passenger flight segment $ 55.03 2.2% $ 53.84 4.8% $ 51.39
Total revenue per passenger flight segment . . . . . . . . . . . $ 135.14 1.4% $ 133.27 5.4% $ 126.50
2014 compared to 2013
Operating revenue increased by $277.2 million, or 16.8%, to $1,931.6 million in 2014 compared to 2013, primarily due to
an increase in traffic of 18.0%, offset slightly by a decrease in average yield of 1.1% to 13.64 cents.
Our results for 2014 were driven by a capacity increase of 17.9% compared to 2013, while maintaining a high load factor
of 86.7%. Total RASM for 2014 was 11.82 cents, a decrease of 1.0% compared to 2013, as a result of lower operating yields on
relatively stable load factors. Total revenue per passenger flight segment increased 1.4% from $133.27 in 2013 to $135.14 in
2014. The year-over-year increase in total revenue per passenger flight segment is due to higher non-ticket revenue per
passenger flight segment offset by lower ticket revenue per passenger flight segment.
During 2014, we increased our average non-ticket revenue per passenger flight segment by 2.2%, or $1.19, to $55.03.
Our total non-ticket revenue increased by 17.7%, or $118.2 million, to $786.6 million in 2014. The year-over-year increase in
average non-ticket revenue per passenger flight segment was primarily driven by a higher volume of passengers electing to
purchase seat assignments, largely due to a software update completed in 2014 that enables us to sell seat assignments through
more channels as well as a more rigorous approach to managing our seat inventory. Additionally, in July 2013, we increased
our passenger usage fee (PUF), helping to drive the increase in PUF fees year over year.
2013 compared to 2012
Operating revenues increased by $336.0 million, or 25.5%, to $1,654.4 million in 2013 compared to 2012 as we
increased traffic by 24.2% and improved our average yield by 1.1% to 13.79 cents.
Our results for 2013 were driven by a capacity increase of 22.2% compared to 2012, while maintaining a high load factor
of 86.6%, and an increase of 1.4 points compared to 2012. In addition, the year-over-year increase was partly attributable to the
negative revenue impact in the fourth quarter 2012 related to Hurricane Sandy which we estimated to be $25 million. Total
RASM for 2013 was 11.94 cents, an increase of 2.8% compared to 2012, as a result of higher average passenger yields and
higher load factor. Total revenue per passenger flight segment increased 5.4% from $126.50 in 2012 to $133.27 in 2013.
Non-ticket revenue increased 24.8% in 2013, as compared to 2012, mainly due to a 24.2% increase in traffic and an
increase in baggage revenue per passenger flight segment. Non-ticket revenue as a percentage of total revenue remained
relatively stable from 40.6% for 2012 to 40.4% for 2013. On a per passenger segment basis, the increase in non-ticket revenue
was attributable to changes in our bag fee schedule which better optimized revenue by channel. Additionally, during June 2012
and July 2013, we made adjustments to our PUF, helping to drive the increase in PUF fees year over year.
Stronger demand throughout 2013, particularly in the second half of the year, as compared to 2012, allowed us to better
leverage our ability to revenue manage our inventory, resulting in higher ticket revenue per passenger segment. Our average
ticket fare per passenger flight segment increased 5.8% from $75.11 in 2012 to $79.43 in 2013.