Spirit Airlines 2014 Annual Report Download - page 47
Download and view the complete annual report
Please find page 47 of the 2014 Spirit Airlines annual report below. You can navigate through the pages in the report by either clicking on the pages listed below, or by using the keyword search tool below to find specific information within the annual report.-
 1
1 -
2
-
3
-
4
-
5
-
6
-
7
-
8
-
9
-
10
-
11
-
12
-
13
-
14
-
15
-
16
-
17
-
18
-
19
-
20
-
21
-
22
-
23
-
24
-
25
-
26
-
27
-
28
-
29
-
30
-
31
-
32
-
33
-
34
-
35
-
36
-
 37
37 -
 38
38 -
 39
39 -
 40
40 -
 41
41 -
 42
42 -
 43
43 -
 44
44 -
 45
45 -
 46
46 -
 47
47 -
 48
48 -
 49
49 -
 50
50 -
 51
51 -
 52
52 -
 53
53 -
 54
54 -
 55
55 -
 56
56 -
 57
57 -
58
-
59
-
60
-
61
-
62
-
63
-
64
-
65
-
66
-
67
-
68
-
69
-
70
-
71
-
72
-
73
-
74
-
75
-
76
-
77
-
78
-
79
-
80
-
81
-
82
-
83
-
84
-
85
-
86
-
87
-
88
-
89
-
90
-
91
-
92
-
93
-
94
-
95
-
96
-
97
-
98
-
99
 |
 |

47
expense is unrealized mark-to-market changes in the value of aircraft fuel derivatives outstanding. In addition, in our
calculation for economic fuel price for the current year, we are excluding the prior years' additional jet fuel FET amount of $9.3
million expensed in the third quarter of 2014, but including the year-to-date 2014 additional jet fuel FET amount of $2.1
million. Many industry analysts evaluate airline results using economic fuel expense and it is used in our internal management
reporting.
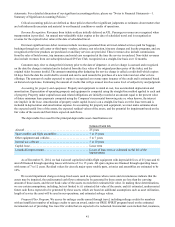
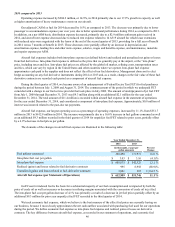
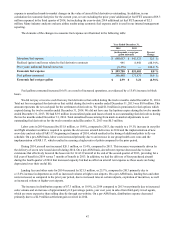
The elements of the changes in economic fuel expense are illustrated in the following table:
Year Ended December 31,
2014 2013
(in thousands, except per
gallon amounts) Percent
Change
Into-plane fuel expense $ 608,033 $ 542,523 12.1 %
Realized (gains) and losses related to fuel derivative contracts 995 8,958 (88.9 )%
Prior years' additional federal excise tax (9,278) — 100.0 %
Economic fuel expense $ 599,750 $ 551,481 8.8 %
Fuel gallons consumed 200,498 171,931 16.6 %
Economic fuel cost per gallon $ 2.99 $ 3.21 (6.9)%
Fuel gallons consumed increased 16.6% as a result of increased operations, as evidenced by a 15.6% increase in block
hours.
We did not pay or receive cash from any fuel derivatives that settled during the twelve months ended December 31, 2014.
Total net loss recognized for derivatives that settled during the twelve months ended December 31, 2013 was $9.0 million. This
amount represents the net cash paid for the settlement of derivatives. We paid $1.0 million in premiums for fuel options which
expired during the twelve months ended December 31, 2014. We did not have any fuel options expire during the twelve months
ended December 31, 2013. We had $3.9 million in unrealized gains and losses related to our outstanding fuel derivatives during
the twelve months ended December 31, 2014. Total unrealized losses arising from mark-to-market adjustments to our
outstanding fuel derivatives for the twelve months ended December 31, 2013 was $0.3 million.
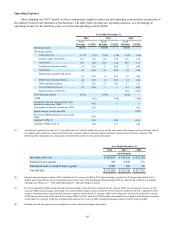
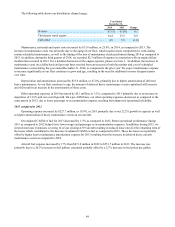
Labor costs in 2014 increased by $51.8 million, or 19.8%, compared to 2013, due mainly to a 19.1% increase in our pilot
and flight attendant workforce required to operate the eleven new aircraft deliveries in 2014 and the implementation of new
crew duty and rest rules (FAR 117) beginning in January of 2014, which resulted in the hiring of additional pilots to fly our
schedule. On a per-ASM basis, labor costs increased primarily due to an increase in our group health care costs and the
implementation of FAR 117, which resulted in carrying a higher ratio of pilots compared to the prior period.
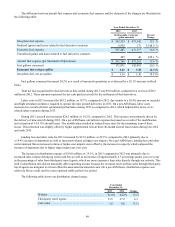
During 2014, aircraft rent increased $26.1 million, or 15.4%, compared to 2013. This increase was primarily driven by
the delivery of seven new leased aircraft during 2014. On a per-ASM basis, aircraft rent expense decreased due to lease
extensions that effectively lowered the lease rate for 14 A319 aircraft at the end of the second quarter of 2013, providing for a
full year of benefit in 2014 versus 7 months of benefit in 2013. In addition, we had the delivery of four purchased aircraft
during the fourth quarter of 2014 that increased capacity but had no affect on aircraft rent expense as these assets are being
depreciated over their useful life.
Landing fees and other rents for 2014 increased by $21.5 million, or 25.7%, compared to 2013 primarily due to
a 13.6% increase in departures as well as increased volume at higher cost airports. On a per-ASM basis, landing fees and other
rents increased, as compared to the prior year period, due to increased rates at certain airports, expiration of incentives, as well
as increased volume at higher-cost airports.
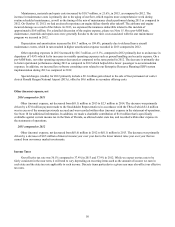
The increase in distribution expense of $7.3 million, or 10.9%, in 2014 compared to 2013 was primarily due to increased
sales volume and an increase of approximately 0.9 percentage points, year over year, in sales from third-party travel agents,
which are more expensive than selling directly through our website. On a per-ASM basis, distribution expense decreased
primarily due to a $2.9 million settlement gain received in 2014.