Spirit Airlines 2014 Annual Report Download - page 33
Download and view the complete annual report
Please find page 33 of the 2014 Spirit Airlines annual report below. You can navigate through the pages in the report by either clicking on the pages listed below, or by using the keyword search tool below to find specific information within the annual report.-
 1
1 -
2
-
3
-
4
-
5
-
6
-
7
-
8
-
9
-
10
-
11
-
12
-
13
-
14
-
15
-
16
-
17
-
18
-
19
-
20
-
21
-
22
-
 23
23 -
 24
24 -
 25
25 -
 26
26 -
 27
27 -
 28
28 -
 29
29 -
 30
30 -
 31
31 -
 32
32 -
 33
33 -
 34
34 -
 35
35 -
 36
36 -
 37
37 -
 38
38 -
 39
39 -
 40
40 -
 41
41 -
 42
42 -
 43
43 -
44
-
45
-
46
-
47
-
48
-
49
-
50
-
51
-
52
-
53
-
54
-
55
-
56
-
57
-
58
-
59
-
60
-
61
-
62
-
63
-
64
-
65
-
66
-
67
-
68
-
69
-
70
-
71
-
72
-
73
-
74
-
75
-
76
-
77
-
78
-
79
-
80
-
81
-
82
-
83
-
84
-
85
-
86
-
87
-
88
-
89
-
90
-
91
-
92
-
93
-
94
-
95
-
96
-
97
-
98
-
99
 |
 |

33
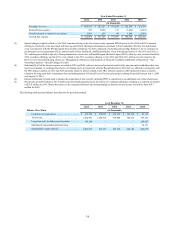
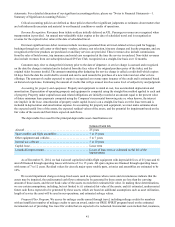
ITEM 6. SELECTED FINANCIAL DATA
You should read the following selected historical financial and operating data below in conjunction with “Management’s
Discussion and Analysis of Financial Condition and Results of Operations” and the financial statements, related notes and other
financial information included in this annual report. The selected financial data in this section are not intended to replace the
financial statements and are qualified in their entirety by the financial statements and related notes included in this annual
report.
We derived the selected statements of operations data for the years ended December 31, 2014, 2013 and 2012 and the
balance sheet data as of December 31, 2014 and 2013 from our audited financial statements included in this annual report. We
derived the selected statements of operations data for the years ended December 31, 2011 and 2010 and the balance sheet data
as of December 31, 2012, 2011 and 2010 from our audited financial statements not included in this annual report. Our historical
results are not necessarily indicative of the results to be expected in the future.
Year Ended December 31,
2014 2013 2012 2011 2010 (1)
(in thousands, except share and per share data)
Operating revenues:
Passenger $ 1,144,972 $ 986,018 $ 782,792 $ 689,650 $ 537,969
Non-ticket 786,608 668,367 535,596 381,536 243,296
Total operating revenue 1,931,580 1,654,385 1,318,388 1,071,186 781,265
Operating expenses:
Aircraft fuel (2) . . . . . . . . . . . . . . . . . . . . . . . . . . . . . . . . . . . . . . . . . . . . . . . 612,909 551,746 471,763 388,046 248,206
Salaries, wages and benefits . . . . . . . . . . . . . . . . . . . . . . . . . . . . . . . . . . . . . 313,988 262,150 218,919 181,742 156,443
Aircraft rent. . . . . . . . . . . . . . . . . . . . . . . . . . . . . . . . . . . . . . . . . . . . . . . . . . 195,827 169,737 143,572 116,485 101,345
Landing fees and other rents . . . . . . . . . . . . . . . . . . . . . . . . . . . . . . . . . . . . . 105,115 83,604 68,368 52,794 48,118
Distribution . . . . . . . . . . . . . . . . . . . . . . . . . . . . . . . . . . . . . . . . . . . . . . . . . . 74,823 67,481 56,668 51,349 41,179
Maintenance, materials and repairs. . . . . . . . . . . . . . . . . . . . . . . . . . . . . . . . 73,956 60,143 49,460 34,017 27,035
Depreciation and amortization . . . . . . . . . . . . . . . . . . . . . . . . . . . . . . . . . . . 46,971 31,947 15,256 7,760 5,620
Other operating . . . . . . . . . . . . . . . . . . . . . . . . . . . . . . . . . . . . . . . . . . . . . . . 149,675 144,586 127,886 91,172 83,748
Loss on disposal of assets . . . . . . . . . . . . . . . . . . . . . . . . . . . . . . . . . . . . . . . 3,008 525 956 255 77
Special charges (credits) (3) . . . . . . . . . . . . . . . . . . . . . . . . . . . . . . . . . . . . . 45 174 (8,450) 3,184 621
Total operating expenses 1,576,317 1,372,093 1,144,398 926,804 712,392
Operating income 355,263 282,292 173,990 144,382 68,873
Other expense (income):
Interest expense (4) . . . . . . . . . . . . . . . . . . . . . . . . . . . . . . . . . . . . . . . . . . . . 2,747 214 1,350 24,781 50,313
Capitalized interest (5) . . . . . . . . . . . . . . . . . . . . . . . . . . . . . . . . . . . . . . . . . (2,747) (214) (1,350) (2,890) (1,491)
Interest income . . . . . . . . . . . . . . . . . . . . . . . . . . . . . . . . . . . . . . . . . . . . . . . (336) (401) (925) (575) (328)
Other expense . . . . . . . . . . . . . . . . . . . . . . . . . . . . . . . . . . . . . . . . . . . . . . . . 2,605 283 331 235 194
Total other expense (income). . . . . . . . . . . . . . . . . . . . . . . . . . . . . . . . . . . . . . 2,269 (118) (594) 21,551 48,688
Income before income taxes. . . . . . . . . . . . . . . . . . . . . . . . . . . . . . . . . . . . . . . 352,994 282,410 174,584 122,831 20,185
Provision (benefit) for income taxes (6). . . . . . . . . . . . . . . . . . . . . . . . . . . . . . 127,530 105,492 66,124 46,383 (52,296)
Net income $ 225,464 $ 176,918 $ 108,460 $ 76,448 $ 72,481
Earnings Per Share:
Basic . . . . . . . . . . . . . . . . . . . . . . . . . . . . . . . . . . . . . . . . . . . . . . . . . . . . . . . $ 3.10 $ 2.44 $ 1.50 $ 1.44 $ 2.77
Diluted. . . . . . . . . . . . . . . . . . . . . . . . . . . . . . . . . . . . . . . . . . . . . . . . . . . . . . $ 3.08 $ 2.42 $ 1.49 $ 1.43 $ 2.72
Weighted average shares outstanding:
Basic . . . . . . . . . . . . . . . . . . . . . . . . . . . . . . . . . . . . . . . . . . . . . . . . . . . . . . . 72,738,961 72,592,765 72,385,574 53,240,898 26,183,772
Diluted. . . . . . . . . . . . . . . . . . . . . . . . . . . . . . . . . . . . . . . . . . . . . . . . . . . . . . 73,293,869 72,999,221 72,590,574 53,515,348 26,689,855
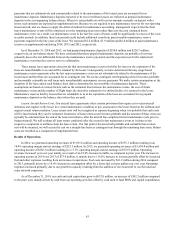
(1) We estimate that the 2010 pilot strike had a net negative impact on our operating income for 2010 of approximately $24 million consisting of an
estimated $28 million in lost revenues and approximately $4 million of incremental costs resulting from the strike, offset in part by a reduction of
variable expenses during the strike of approximately $8 million for flights not flown. Additionally, under the terms of the pilot contract, we also paid
$2.3 million in return-to-work payments during the second quarter, which are not included in the strike impact costs described above.
(2) Aircraft fuel expense is the sum of (i) “into-plane fuel cost,” which includes the cost of jet fuel and certain other charges such as fuel taxes and oil,
(ii) realized gains and losses related to fuel derivative contracts and (iii) unrealized gains and losses related to fuel derivative contracts. The
following table summarizes the components of aircraft fuel expense for the periods presented: