Spirit Airlines 2014 Annual Report Download - page 6
Download and view the complete annual report
Please find page 6 of the 2014 Spirit Airlines annual report below. You can navigate through the pages in the report by either clicking on the pages listed below, or by using the keyword search tool below to find specific information within the annual report.-
 1
1 -
 2
2 -
 3
3 -
 4
4 -
 5
5 -
 6
6 -
 7
7 -
 8
8 -
 9
9 -
 10
10 -
 11
11 -
 12
12 -
 13
13 -
 14
14 -
 15
15 -
 16
16 -
 17
17 -
18
-
19
-
20
-
21
-
22
-
23
-
24
-
25
-
26
-
27
-
28
-
29
-
30
-
31
-
32
-
33
-
34
-
35
-
36
-
37
-
38
-
39
-
40
-
41
-
42
-
43
-
44
-
45
-
46
-
47
-
48
-
49
-
50
-
51
-
52
-
53
-
54
-
55
-
56
-
57
-
58
-
59
-
60
-
61
-
62
-
63
-
64
-
65
-
66
-
67
-
68
-
69
-
70
-
71
-
72
-
73
-
74
-
75
-
76
-
77
-
78
-
79
-
80
-
81
-
82
-
83
-
84
-
85
-
86
-
87
-
88
-
89
-
90
-
91
-
92
-
93
-
94
-
95
-
96
-
97
-
98
-
99
 |
 |
6
carriers because we have been conducting international flight operations since 2003 and have developed substantial experience
in complying with the various regulations and business practices in the international markets we serve. During 2014, 2013 and
2012, no revenue from any one foreign country represented greater than 4% of the our total passenger revenue. We attribute
operating revenues by geographic region based upon the origin and destination of each passenger flight segment.
Financial Strength Achieved with Focus on Cost Discipline. We believe our ULCC business model has delivered strong
financial results in both favorable and more difficult economic times. We have generated these results by:
• keeping a consistent focus on maintaining low unit operating costs;
• ensuring our sourcing arrangements with key third parties are regularly benchmarked against the best industry
standards;
• generating and maintaining an adequate level of liquidity to insulate against volatility in key cost inputs, such as fuel,
and in passenger demand that may occur as a result of changing general economic conditions.
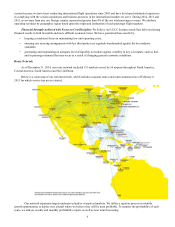
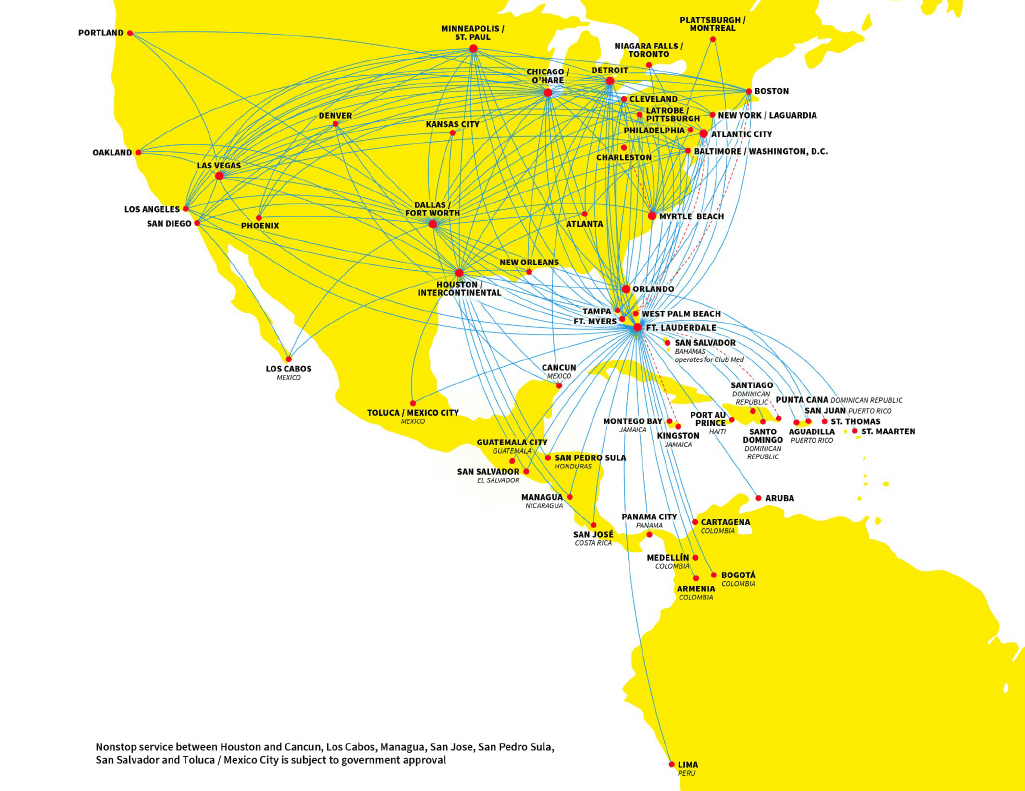
Route Network
As of December 31, 2014, our route network included 151 markets served by 56 airports throughout North America,
Central America, South America and the Caribbean.
Below is a route map of our current network, which includes seasonal routes and routes announced as of February 6,
2015 for which service has not yet started:
Our network expansion targets underserved and/or overpriced markets. We utilize a rigorous process to identify
growth opportunities to deploy new aircraft where we believe they will be most profitable. To monitor the profitability of each
route, we analyze weekly and monthly profitability reports as well as near term forecasting.