Spirit Airlines 2014 Annual Report Download - page 75
Download and view the complete annual report
Please find page 75 of the 2014 Spirit Airlines annual report below. You can navigate through the pages in the report by either clicking on the pages listed below, or by using the keyword search tool below to find specific information within the annual report.-
 1
1 -
2
-
3
-
4
-
5
-
6
-
7
-
8
-
9
-
10
-
11
-
12
-
13
-
14
-
15
-
16
-
17
-
18
-
19
-
20
-
21
-
22
-
23
-
24
-
25
-
26
-
27
-
28
-
29
-
30
-
31
-
32
-
33
-
34
-
35
-
36
-
37
-
38
-
39
-
40
-
41
-
42
-
43
-
44
-
45
-
46
-
47
-
48
-
49
-
50
-
51
-
52
-
53
-
54
-
55
-
56
-
57
-
58
-
59
-
60
-
61
-
62
-
63
-
64
-
 65
65 -
 66
66 -
 67
67 -
 68
68 -
 69
69 -
 70
70 -
 71
71 -
 72
72 -
 73
73 -
 74
74 -
 75
75 -
 76
76 -
 77
77 -
 78
78 -
 79
79 -
 80
80 -
 81
81 -
 82
82 -
 83
83 -
 84
84 -
 85
85 -
86
-
87
-
88
-
89
-
90
-
91
-
92
-
93
-
94
-
95
-
96
-
97
-
98
-
99
 |
 |

Notes to Financial Statements—(Continued)
75
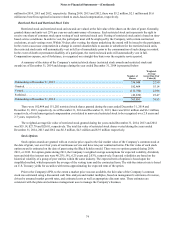
A summary of share option activity under the 2011 Plan as of December 31, 2014 and changes during the year ended
December 31, 2014 is presented below:
Number
of Options
Weighted-
Average
Exercise
Price ($)
Average
Remaining
Contractual
Term
(Years)
Aggregate
Intrinsic
Value
($000)
Outstanding at December 31, 2013 56,500 8.26 6.7 2,099
Exercised (21,125) 8.18
Forfeited or expired (3,750) 8.21
Outstanding at December 31, 2014 31,625 8.32 5.7 2,127
Exercisable at December 31, 2014 30,875 8.22 5.7 2,080
Vested or Expected to Vest at December 31, 2014 31,614 8.32 5.7 2,126
There were no options granted during the years ended December 31, 2014, 2013, or 2012. The total intrinsic value of
share options exercised during the years ended December 31, 2014, 2013 and 2012 was $1.3 million, $2.0 million and $0.7
million, respectively. The total fair value of options vested during the years ended December 31, 2014, 2013 and 2012 was $0.1
million, $0.2 million and $0.4 million, respectively.
As of December 31, 2014 and December 31, 2013, there was $3.1 thousand and $46.7 thousand respectively, of total
unrecognized compensation cost related to options expected to be recognized over 0.7 years and 0.8 years, respectively.
Performance Share Awards
During 2014 and 2013, the Company granted certain senior-level executives performance stock units that vest based on
market and time-based service conditions as part of a long-term incentive plan, which are referred to herein as performance
share awards. The number of shares of common stock underlying each award is determined at the end of a three-year
performance period. In order to vest, the senior level executive must still be employed by the Company, with certain contractual
exclusions, at the end of the performance period. At the end of the performance period, the percentage of the stock units that
will vest will be determined by ranking the Company’s total shareholder return compared to the total shareholder return of the
peer companies identified in the plan. Based on the level of performance, between 0% and 200% of the award may vest. Within
60 days after vesting, the shares underlying the award will be issued to the participant. In the event of a change in control of the
Company or the death or permanent disability of a participant, the payout of any award is limited to a pro-rated portion of such
award based upon a performance assessment prior to the change-in-control date or date of death or permanent disability.
The market condition requirements are reflected in the grant date fair value of the award, and the compensation expense,
net of forfeitures, for the award will be recognized assuming that the requisite service is rendered regardless of whether the
market conditions are achieved.
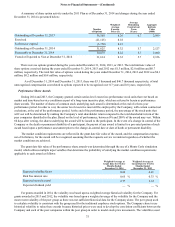
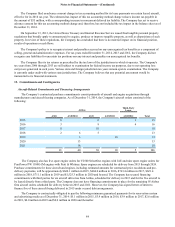
The grant date fair value of the performance share awards was determined through the use of a Monte Carlo simulation
model, which utilizes multiple input variables that determine the probability of satisfying the market condition requirements
applicable to each award as follows:
Weighted-Average at
Grant Date for Twelve
Months Ended
December 31, 2014
Weighted-Average at
Grant Date for Twelve
Months Ended
December 31, 2013
Expected volatility factor 0.42 0.41
Risk free interest rate 0.65 % 0.33 %
Expected term (in years) 2.77 2.65
Expected dividend yield — % — %
For grants awarded in 2014, the volatility was based upon a weighted average historical volatility for the Company. For
grants awarded in 2013 and 2012, the volatility was based upon a weighted average of the volatility for the Company and the
most recent volatility of the peer group as there was not sufficient historical data for the Company alone. The peer group used
to calculate volatility is consistent with the group used for the traditional employee stock options. The Company chose to use
historical volatility to value these awards because historical prices were used to develop the correlation coefficients between the
Company and each of the peer companies within the peer group in order to model stock price movements. The volatilities used