Spirit Airlines 2014 Annual Report Download - page 63
Download and view the complete annual report
Please find page 63 of the 2014 Spirit Airlines annual report below. You can navigate through the pages in the report by either clicking on the pages listed below, or by using the keyword search tool below to find specific information within the annual report.-
 1
1 -
2
-
3
-
4
-
5
-
6
-
7
-
8
-
9
-
10
-
11
-
12
-
13
-
14
-
15
-
16
-
17
-
18
-
19
-
20
-
21
-
22
-
23
-
24
-
25
-
26
-
27
-
28
-
29
-
30
-
31
-
32
-
33
-
34
-
35
-
36
-
37
-
38
-
39
-
40
-
41
-
42
-
43
-
44
-
45
-
46
-
47
-
48
-
49
-
50
-
51
-
52
-
 53
53 -
 54
54 -
 55
55 -
 56
56 -
 57
57 -
 58
58 -
 59
59 -
 60
60 -
 61
61 -
 62
62 -
 63
63 -
 64
64 -
 65
65 -
 66
66 -
 67
67 -
 68
68 -
 69
69 -
 70
70 -
 71
71 -
 72
72 -
 73
73 -
74
-
75
-
76
-
77
-
78
-
79
-
80
-
81
-
82
-
83
-
84
-
85
-
86
-
87
-
88
-
89
-
90
-
91
-
92
-
93
-
94
-
95
-
96
-
97
-
98
-
99
 |
 |

63
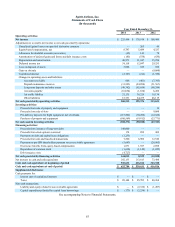
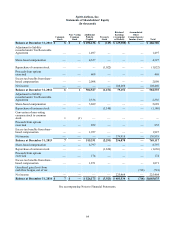
Spirit Airlines, Inc.
Statements of Cash Flows
(In thousands)
Year Ended December 31,
2014 2013 2012
Operating activities:
Net income $ 225,464 $ 176,918 $ 108,460
Adjustments to reconcile net income to net cash provided by operations:
Unrealized (gains) losses on open fuel derivative contracts — 265 46
Equity-based compensation, net 8,797 5,689 4,327
Allowance for doubtful accounts (recoveries) (45) 143 78
Amortization of deferred gains and losses and debt issuance costs (185) (558) (830)
Depreciation and amortization 46,971 31,947 15,256
Deferred income tax 34,118 12,047 29,255
Loss on disposal of assets 3,008 525 956
Gain on slot sale — — (9,060)
Capitalized interest (2,747) (214) (1,350)
Changes in operating assets and liabilities:
Accounts receivable 606 (461) (7,393)
Prepaid maintenance reserves (31,925) (24,058) (31,567)
Long-term deposits and other assets (48,382) (65,654) (68,248)
Accounts payable (10,034) (1,674) 8,452
Air traffic liability 21,135 36,226 19,134
Other liabilities 13,731 24,235 46,115
Net cash provided by operating activities 260,512 195,376 113,631
Investing activities:
Proceeds from sale of property and equipment — — 14
Proceeds from sale of slots — — 9,060
Pre-delivery deposits for flight equipment, net of refunds (115,802) (70,288) (12,626)
Purchase of property and equipment (186,569) (19,812) (23,771)
Net cash used in investing activities (302,371) (90,100) (27,323)
Financing activities:
Proceeds from issuance of long-term debt 148,000 — —
Proceeds from stock options exercised 174 852 469
Payments on debt and capital lease obligations (1,233) — —
Proceeds from sale and leaseback transactions 7,200 6,900 12,540
Payments to pre-IPO shareholders pursuant to tax receivable agreement (5,643) — (26,905)
Excess tax benefits from equity-based compensation 1,871 1,927 2,098
Repurchase of common stock (1,630) (1,140) (1,022)
Debt issuance costs (4,727) — —
Net cash provided by financing activities 144,012 8,539 (12,820)
Net increase in cash and cash equivalents 102,153 113,815 73,488
Cash and cash equivalents at beginning of period 530,631 416,816 343,328
Cash and cash equivalents at end of period $ 632,784 $ 530,631 $ 416,816
Supplemental disclosures
Cash payments for:
Interest (net of capitalized interest) $ — $ — $ —
Taxes $ 89,104 $ 85,705 $ 40,204
Non-cash transactions:
Liability and equity related to tax receivable agreement $ — $ (2,336) $ (1,497)
Capital expenditures funded by capital lease borrowings $ (173) $ (3,234) $ —
See accompanying Notes to Financial Statements.