Spirit Airlines 2014 Annual Report Download - page 50
Download and view the complete annual report
Please find page 50 of the 2014 Spirit Airlines annual report below. You can navigate through the pages in the report by either clicking on the pages listed below, or by using the keyword search tool below to find specific information within the annual report.-
 1
1 -
2
-
3
-
4
-
5
-
6
-
7
-
8
-
9
-
10
-
11
-
12
-
13
-
14
-
15
-
16
-
17
-
18
-
19
-
20
-
21
-
22
-
23
-
24
-
25
-
26
-
27
-
28
-
29
-
30
-
31
-
32
-
33
-
34
-
35
-
36
-
37
-
38
-
39
-
 40
40 -
 41
41 -
 42
42 -
 43
43 -
 44
44 -
 45
45 -
 46
46 -
 47
47 -
 48
48 -
 49
49 -
 50
50 -
 51
51 -
 52
52 -
 53
53 -
 54
54 -
 55
55 -
 56
56 -
 57
57 -
 58
58 -
 59
59 -
 60
60 -
61
-
62
-
63
-
64
-
65
-
66
-
67
-
68
-
69
-
70
-
71
-
72
-
73
-
74
-
75
-
76
-
77
-
78
-
79
-
80
-
81
-
82
-
83
-
84
-
85
-
86
-
87
-
88
-
89
-
90
-
91
-
92
-
93
-
94
-
95
-
96
-
97
-
98
-
99
 |
 |
50
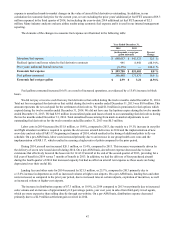
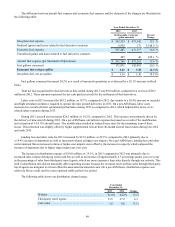
Maintenance, materials and repair costs increased by $10.7 million, or 21.6%, in 2013, as compared to 2012. The
increase in maintenance costs is primarily due to the aging of our fleet, which requires more comprehensive work during
routine scheduled maintenance, as well as the timing of the mix of maintenance checks performed during 2013 as compared to
2012. On October 15, 2013, we had an aircraft experience an engine failure shortly after takeoff. The airframe and engine
incurred damage as a result of the failure. In 2013, we expensed the insurance deductible related to this incident of
approximately $0.8 million. For a detailed discussion of the engine expense, please see Note 15. On a per-ASM basis,
maintenance, materials and repair costs were generally flat due to the one time costs associated with the seat maintenance
program we incurred in 2012.
Depreciation and amortization increased by $16.7 million, or 109.4%, primarily due to deferred heavy aircraft
maintenance events, which in turn resulted in higher amortization expense recorded in 2013 compared to 2012.
Other operating expenses in 2013 increased by $16.7 million, or 13.1%, compared to 2012 primarily due to an increase in
departures of 14.9% which led to increases in variable operating expenses such as ground handling and security expense. On a
per-ASM basis, our other operating expenses decreased as compared to the same period in 2012. The decrease is primarily due
to better operational performance during 2013 as compared to 2012 which helped drive lower passenger re-accommodation
expenses. In addition, we incurred less software consulting costs related to our Enterprise Resource Planning (ERP) system
implementation during 2013 as compared to 2012.
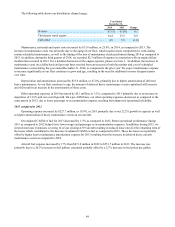
Special charges (credits) for 2012 primarily include a $9.1 million gain related to the sale of four permanent air carrier
slots at Ronald Reagan National Airport (DCA), offset by $0.6 million in secondary offering costs.
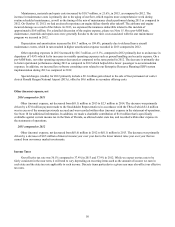
Other (income) expense, net
2014 compared to 2013
Other (income) expense, net decreased from $(0.1) million in 2013 to $2.3 million in 2014. The decrease was primarily
driven by a $7.0 million payment made to the Stockholder Representatives in accordance with the TRA of which $1.4 million
was in excess of the amount previously accrued and was recorded within other (income) expense in the statement of operations.
See Note 18 for additional information. In addition, we made a charitable contribution of $1.0 million that is specifically
creditable against current income tax in the State of Florida, as allowed under state law, and recorded within other expense in
the statements of operations.
2013 compared to 2012
Other (income) expense, net decreased from $(0.6) million in 2012 to $(0.1) million in 2013. The decrease was primarily
driven by a decrease of $0.5 million of interest income year over year due to the lower interest rates year over year that we
earned from our money market investments.
Income Taxes
Our effective tax rate was 36.1% compared to 37.4% in 2013 and 37.9% in 2012. While we expect our tax rate to be
fairly consistent in the near term, it will tend to vary depending on recurring items such as the amount of income we earn in
each state and the state tax rate applicable to such income. Discrete items particular to a given year may also affect our effective
tax rates.