Spirit Airlines 2014 Annual Report Download - page 46
Download and view the complete annual report
Please find page 46 of the 2014 Spirit Airlines annual report below. You can navigate through the pages in the report by either clicking on the pages listed below, or by using the keyword search tool below to find specific information within the annual report.-
 1
1 -
2
-
3
-
4
-
5
-
6
-
7
-
8
-
9
-
10
-
11
-
12
-
13
-
14
-
15
-
16
-
17
-
18
-
19
-
20
-
21
-
22
-
23
-
24
-
25
-
26
-
27
-
28
-
29
-
30
-
31
-
32
-
33
-
34
-
35
-
 36
36 -
 37
37 -
 38
38 -
 39
39 -
 40
40 -
 41
41 -
 42
42 -
 43
43 -
 44
44 -
 45
45 -
 46
46 -
 47
47 -
 48
48 -
 49
49 -
 50
50 -
 51
51 -
 52
52 -
 53
53 -
 54
54 -
 55
55 -
 56
56 -
57
-
58
-
59
-
60
-
61
-
62
-
63
-
64
-
65
-
66
-
67
-
68
-
69
-
70
-
71
-
72
-
73
-
74
-
75
-
76
-
77
-
78
-
79
-
80
-
81
-
82
-
83
-
84
-
85
-
86
-
87
-
88
-
89
-
90
-
91
-
92
-
93
-
94
-
95
-
96
-
97
-
98
-
99
 |
 |

46
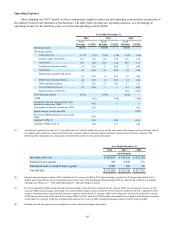
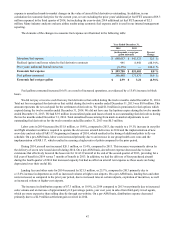
2014 compared to 2013
Operating expense increased by $204.2 million, or 14.9%, in 2014 primarily due to our 17.9% growth in capacity as well
as higher amortization of heavy maintenance events on our aircraft.
Our adjusted CASM ex fuel for 2014 decreased by 0.5% as compared to 2013. The decrease was primarily due to lower
passenger re-accommodation expense year over year, due to better operational performance during 2014, as compared to 2013.
In addition, on a per ASM basis, distribution expense decreased, primarily due to a $2.9 million settlement gain received in
2014, and aircraft rent expense decreased due to reduced rent expense related to 14 A319 aircraft for which lease extensions
with reduced rates were negotiated with the lessor at the end of the second quarter of 2013, providing for a full year of benefit
in 2014 versus 7 months of benefit in 2013. These decreases were partially offset by an increase in depreciation and
amortization expense, landing fees and other rents expense, salaries, wages and benefits expense, and maintenance, materials
and repairs expense per ASM.
Aircraft fuel expenses includes both into-plane expense (as defined below) and realized and unrealized net gains or losses
from fuel derivatives. Into-plane fuel expense is defined as the price that we generally pay at the airport, or the “into-plane”
price, including taxes and fees. Into-plane fuel prices are affected by the global oil market, refining costs, transportation taxes
and fees, which can vary by region in the United States and other countries where we operate. Into-plane fuel expense
approximates cash paid to the supplier and does not reflect the effect of our fuel derivatives. Management chose not to elect
hedge accounting on any fuel derivative instruments during 2014 or 2013 and, as a result, changes in the fair value of these fuel
derivative contracts are recorded each period as a component of aircraft fuel expense.
During the third quarter of 2014, we became aware of an underpayment of Federal Excise Tax (FET) for fuel purchases
during the period between July 1, 2009 and August 31, 2014. The commencement of the period in which we underpaid FET
coincided with a change in our fuel service provider that took place in July 2009. The amount of underpayment of jet fuel FET
from July 1, 2009 through December 31, 2013 was $9.3 million along with an additional $2.1 million for the year ended
December 31, 2014. The total amount of $11.4 million is recorded within aircraft fuel expense in the statement of operations
for the year ended December 31, 2014, and considered a component of into-plane fuel expense. Approximately, $0.8 million of
interest was incurred related to the past-due tax payments.
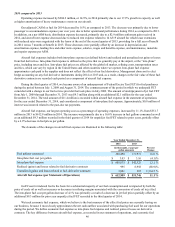
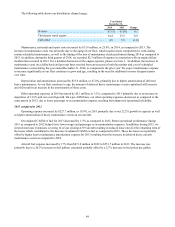
Aircraft fuel expense, our largest operating cost as a percentage of operating expenses, increased by 11.1% from $551.7
million in 2013 to $612.9 million in 2014. The increase was primarily due to a 16.6% increase in fuel gallons consumed as well
as an additional $9.3 million recorded in the third quarter of 2014 for unpaid jet fuel FET related to prior years, partially offset
by a 6.9% decrease in fuel prices per gallon.
The elements of the changes in aircraft fuel expense are illustrated in the following table:
Year Ended December 31,
2014 2013
(in thousands, except per
gallon amounts) Percent
Change
Fuel gallons consumed 200,498 171,931 16.6 %
Into-plane fuel cost per gallon $ 3.03 $ 3.16 (4.1)%
Into-plane fuel expense $ 608,033 $ 542,523 12.1 %
Realized (gains) and losses related to fuel derivative contracts 995 8,958 (88.9)%
Unrealized (gains) and losses related to fuel derivative contracts 3,881 265 1,364.5 %
Aircraft fuel expense (per Statement of Operations) $ 612,909 $ 551,746 11.1 %
Gulf Coast Jet indexed fuel is the basis for a substantial majority of our fuel consumption and is impacted by both the
price of crude oil as well as increases or decreases in refining margins associated with the conversion of crude oil to jet fuel.
The into-plane fuel cost per gallon decrease of 4.1% was primarily a result of a decrease in jet fuel prices partially offset by an
additional $9.3 million for prior year unpaid jet fuel FET recorded in the third quarter of 2014.
We track economic fuel expense, which we believe is the best measure of the effect fuel prices are currently having on
our business, because it most closely approximates the net cash outflow associated with purchasing fuel used for our operations
during the period. We define economic fuel expense as into-plane fuel expense and realized gains or losses on derivative
contracts. The key difference between aircraft fuel expense, as recorded in our statement of operations, and economic fuel