Shaw 2014 Annual Report Download - page 56
Download and view the complete annual report
Please find page 56 of the 2014 Shaw annual report below. You can navigate through the pages in the report by either clicking on the pages listed below, or by using the keyword search tool below to find specific information within the annual report.-
 1
1 -
2
-
3
-
4
-
5
-
6
-
7
-
8
-
9
-
10
-
11
-
12
-
13
-
14
-
15
-
16
-
17
-
18
-
19
-
20
-
21
-
22
-
23
-
24
-
25
-
26
-
27
-
28
-
29
-
30
-
31
-
32
-
33
-
34
-
35
-
36
-
37
-
38
-
39
-
40
-
41
-
42
-
43
-
44
-
45
-
 46
46 -
 47
47 -
 48
48 -
 49
49 -
 50
50 -
 51
51 -
 52
52 -
 53
53 -
 54
54 -
 55
55 -
 56
56 -
 57
57 -
 58
58 -
 59
59 -
 60
60 -
 61
61 -
 62
62 -
 63
63 -
 64
64 -
 65
65 -
 66
66 -
67
-
68
-
69
-
70
-
71
-
72
-
73
-
74
-
75
-
76
-
77
-
78
-
79
-
80
-
81
-
82
-
83
-
84
-
85
-
86
-
87
-
88
-
89
-
90
-
91
-
92
-
93
-
94
-
95
-
96
-
97
-
98
-
99
-
100
-
101
-
102
-
103
-
104
-
105
-
106
-
107
-
108
-
109
-
110
-
111
-
112
-
113
-
114
-
115
-
116
-
117
-
118
-
119
-
120
-
121
-
122
-
123
-
124
-
125
-
126
-
127
-
128
-
129
 |
 |

Shaw Communications Inc.
MANAGEMENT’S DISCUSSION AND ANALYSIS
August 31, 2014
accrued liabilities of $31 million which were partially offset by increases in provisions of $18
million, income taxes payable of $205 million and unearned revenue of $11 million. The
current portion of long-term debt decreased due to the repayment of the 7.5% $350 million
senior notes which were due in November 2013 and early redemption of the 6.5% $600
million senior notes which were due June 2014. Liabilities associated with assets held for sale
decreased as the sale of Historia and Series+ closed during the second quarter at which time
the Company settled the promissory note that had been owing to Corus. Accounts payable and
accruals declined due to a decrease in CRTC benefit obligations as well as timing of payment
and fluctuations in various payables. During the current year, the Company funded the
remaining expenditure commitments in respect of the fiscal 2007 CRTC benefit obligation
which the Company had assumed as part of the media acquisition in 2010. Provisions
increased primarily due to the restructuring while income taxes payable increased due to the
current year expense partially offset by net tax installment payments. Unearned revenue was
higher primarily due to an increase in advance bill payments.
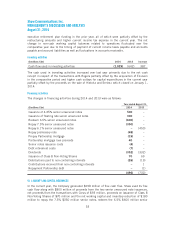
Long-term debt increased $822 million due to the issuance of 4.35% $500 million senior
notes and $300 million floating rate senior notes and the refinancing of the Partnership’s
mortgage debt.
Other long-term liabilities increased $28 million due to an increase in employee benefit plans,
primarily as a result of actuarial losses, partially offset by a decrease in CRTC benefit
obligations.
Deferred credits decreased $10 million due to amortization of deferred IRU revenue.
Deferred income tax liabilities, net of deferred income tax assets, decreased $63 million due to
the current year income tax recovery.
Shareholders’ equity increased $524 million primarily due to increases in share capital of $227
million and retained earnings of $347 million partially offset by an increase in accumulated
other comprehensive loss of $46 million. Share capital increased due to the issuance of
9,199,784 Class B Non-Voting Shares under the Company’s option plan and DRIP. As of
November 15, 2014, share capital is as reported at August 31, 2014 with the exception of the
issuance of a total of 1,951,937 Class B Non-Voting Shares under the DRIP and upon exercise
of options under the Company’s option plan. Retained earnings increased due to current year
earnings of $857 million partially offset by dividends of $510 million. Accumulated other
comprehensive loss increased due to the remeasurements recorded on employee benefit plans.
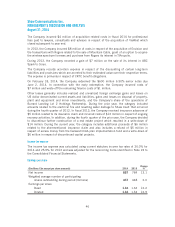
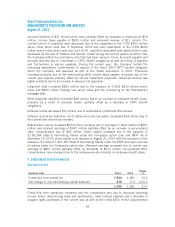
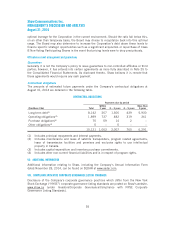
V. CONSOLIDATED CASH FLOW ANALYSIS
Operating activities
($millions Cdn) 2014 2013
Change
%
Funds flow from operations 1,524 1,380 10.4
Net change in non-cash working capital balances 216 (11) >100.0
1,740 1,369 27.1
Funds flow from operations increased over the comparative year due to improved operating
income before restructuring costs and amortization, lower interest expense and a decrease in
program rights purchases in the current year as well as the initial $300 million supplemental
52