Shaw 2014 Annual Report Download - page 46
Download and view the complete annual report
Please find page 46 of the 2014 Shaw annual report below. You can navigate through the pages in the report by either clicking on the pages listed below, or by using the keyword search tool below to find specific information within the annual report.-
 1
1 -
2
-
3
-
4
-
5
-
6
-
7
-
8
-
9
-
10
-
11
-
12
-
13
-
14
-
15
-
16
-
17
-
18
-
19
-
20
-
21
-
22
-
23
-
24
-
25
-
26
-
27
-
28
-
29
-
30
-
31
-
32
-
33
-
34
-
35
-
 36
36 -
 37
37 -
 38
38 -
 39
39 -
 40
40 -
 41
41 -
 42
42 -
 43
43 -
 44
44 -
 45
45 -
 46
46 -
 47
47 -
 48
48 -
 49
49 -
 50
50 -
 51
51 -
 52
52 -
 53
53 -
 54
54 -
 55
55 -
 56
56 -
57
-
58
-
59
-
60
-
61
-
62
-
63
-
64
-
65
-
66
-
67
-
68
-
69
-
70
-
71
-
72
-
73
-
74
-
75
-
76
-
77
-
78
-
79
-
80
-
81
-
82
-
83
-
84
-
85
-
86
-
87
-
88
-
89
-
90
-
91
-
92
-
93
-
94
-
95
-
96
-
97
-
98
-
99
-
100
-
101
-
102
-
103
-
104
-
105
-
106
-
107
-
108
-
109
-
110
-
111
-
112
-
113
-
114
-
115
-
116
-
117
-
118
-
119
-
120
-
121
-
122
-
123
-
124
-
125
-
126
-
127
-
128
-
129
 |
 |

Shaw Communications Inc.
MANAGEMENT’S DISCUSSION AND ANALYSIS
August 31, 2014
III. RESULTS OF OPERATIONS
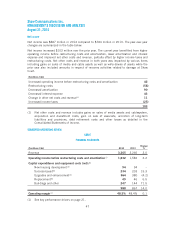
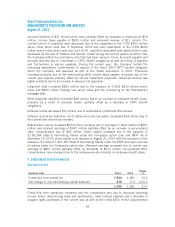
OVERVIEW OF FISCAL 2014 CONSOLIDATED RESULTS
Change
($millions Cdn except per share amounts) 2014 2013 2012
2014
%
2013
%
Operations:
Revenue 5,241 5,142 4,998 1.9 2.9
Operating income before restructuring costs and
amortization(1) 2,262 2,220 2,127 1.9 4.4
Operating margin(1) 43.2% 43.2% 42.6% –0.6
Funds flow from operations(2) 1,524 1,380 1,299 10.4 6.2
Net income 887 784 761 13.1 3.0
Free cash flow(1) 698 604 482 15.6 25.3
Balance sheet:
Total assets 13,250 12,732 12,722
Long-term financial liabilities
Long-term debt (including current portion) 4,690 4,818 5,263
Derivative instruments – – 1
Other financial liabilities 5 53 4
Per share data:
Earnings per share
Basic 1.84 1.64 1.62
Diluted 1.84 1.63 1.61
Weighted average number of participating shares
outstanding during period (millions) 457 448 441
Cash dividends declared per share
Class A 1.0775 1.0050 0.9550
Class B 1.0800 1.0075 0.9575
(1) See key performance drivers on page 21.
(2) Funds flow from operations is presented before changes in non-cash working capital as
presented in the Consolidated Statements of Cash Flows.
Highlights
ŠNet income was $887 million for the year compared to $784 million in 2013.
ŠEarnings per share were $1.84 compared to $1.64 in 2013.
ŠRevenue for the year improved 1.9% to $5.24 billion from $5.14 billion last year.
ŠOperating income before restructuring costs and amortization of $2.26 billion was
up 1.9% over last year’s amount of $2.22 billion.
ŠConsolidated free cash flow was $698 million compared to $604 million in 2013.
ŠDuring 2014 the Company increased the dividend rate on Shaw’s Class A
Participating Shares and Class B Non-Voting Participating Shares to an equivalent
dividend rate of $1.0975 and $1.10 respectively. Dividends paid in 2014 were
$485 million.
42