Shaw 2014 Annual Report Download - page 51
Download and view the complete annual report
Please find page 51 of the 2014 Shaw annual report below. You can navigate through the pages in the report by either clicking on the pages listed below, or by using the keyword search tool below to find specific information within the annual report.-
 1
1 -
2
-
3
-
4
-
5
-
6
-
7
-
8
-
9
-
10
-
11
-
12
-
13
-
14
-
15
-
16
-
17
-
18
-
19
-
20
-
21
-
22
-
23
-
24
-
25
-
26
-
27
-
28
-
29
-
30
-
31
-
32
-
33
-
34
-
35
-
36
-
37
-
38
-
39
-
40
-
 41
41 -
 42
42 -
 43
43 -
 44
44 -
 45
45 -
 46
46 -
 47
47 -
 48
48 -
 49
49 -
 50
50 -
 51
51 -
 52
52 -
 53
53 -
 54
54 -
 55
55 -
 56
56 -
 57
57 -
 58
58 -
 59
59 -
 60
60 -
 61
61 -
62
-
63
-
64
-
65
-
66
-
67
-
68
-
69
-
70
-
71
-
72
-
73
-
74
-
75
-
76
-
77
-
78
-
79
-
80
-
81
-
82
-
83
-
84
-
85
-
86
-
87
-
88
-
89
-
90
-
91
-
92
-
93
-
94
-
95
-
96
-
97
-
98
-
99
-
100
-
101
-
102
-
103
-
104
-
105
-
106
-
107
-
108
-
109
-
110
-
111
-
112
-
113
-
114
-
115
-
116
-
117
-
118
-
119
-
120
-
121
-
122
-
123
-
124
-
125
-
126
-
127
-
128
-
129
 |
 |

Shaw Communications Inc.
MANAGEMENT’S DISCUSSION AND ANALYSIS
August 31, 2014
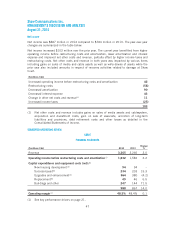
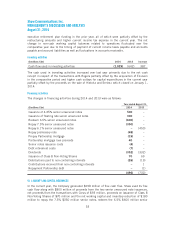
Net income
Net income was $887 million in 2014 compared to $784 million in 2013. The year-over-year
changes are summarized in the table below.
Net income increased $103 million over the prior year. The current year benefitted from higher
operating income before restructuring costs and amortization, lower amortization and interest
expense and improved net other costs and revenue, partially offset by higher income taxes and
restructuring costs. Net other costs and revenue in both years was impacted by various items
including gains on sales of media and cable assets as well as write-downs of assets while the
prior year also included amounts in respect of recovery activities related to damage at Shaw
Court.
($millions Cdn)
Increased operating income before restructuring costs and amortization 42
Restructuring costs (58)
Decreased amortization 90
Decreased interest expense 43
Change in other net costs and revenue(1) 11
Increased income taxes (25)
103
(1) Net other costs and revenue includes gains on sales of media assets and cablesystem,
acquisition and divestment costs, gain on sale of associate, accretion of long-term
liabilities and provisions, debt retirement costs and other losses as detailed in the
Consolidated Statements of Income.
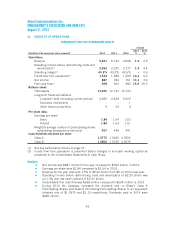
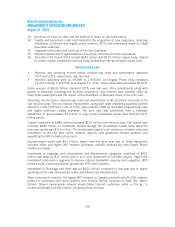
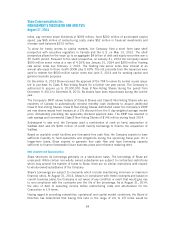
SEGMENTED OPERATIONS REVIEW
CABLE
FINANCIAL HIGHLIGHTS
($millions Cdn) 2014 2013
Change
%
Revenue 3,365 3,266 3.0
Operating income before restructuring costs and amortization(1) 1,632 1,582 3.2
Capital expenditures and equipment costs (net):(6)
New housing development(2) 94 94 –
Success-based(3) 234 203 15.3
Upgrades and enhancement(4) 364 380 (4.2)
Replacement(5) 49 46 6.5
Buildings and other 247 144 71.5
988 867 14.0
Operating margin(1) 48.5% 48.4% 0.1
(1) See key performance drivers on page 21.
47