Shaw 2014 Annual Report Download - page 27
Download and view the complete annual report
Please find page 27 of the 2014 Shaw annual report below. You can navigate through the pages in the report by either clicking on the pages listed below, or by using the keyword search tool below to find specific information within the annual report.-
 1
1 -
2
-
3
-
4
-
5
-
6
-
7
-
8
-
9
-
10
-
11
-
12
-
13
-
14
-
15
-
16
-
 17
17 -
 18
18 -
 19
19 -
 20
20 -
 21
21 -
 22
22 -
 23
23 -
 24
24 -
 25
25 -
 26
26 -
 27
27 -
 28
28 -
 29
29 -
 30
30 -
 31
31 -
 32
32 -
 33
33 -
 34
34 -
 35
35 -
 36
36 -
 37
37 -
38
-
39
-
40
-
41
-
42
-
43
-
44
-
45
-
46
-
47
-
48
-
49
-
50
-
51
-
52
-
53
-
54
-
55
-
56
-
57
-
58
-
59
-
60
-
61
-
62
-
63
-
64
-
65
-
66
-
67
-
68
-
69
-
70
-
71
-
72
-
73
-
74
-
75
-
76
-
77
-
78
-
79
-
80
-
81
-
82
-
83
-
84
-
85
-
86
-
87
-
88
-
89
-
90
-
91
-
92
-
93
-
94
-
95
-
96
-
97
-
98
-
99
-
100
-
101
-
102
-
103
-
104
-
105
-
106
-
107
-
108
-
109
-
110
-
111
-
112
-
113
-
114
-
115
-
116
-
117
-
118
-
119
-
120
-
121
-
122
-
123
-
124
-
125
-
126
-
127
-
128
-
129
 |
 |

Shaw Communications Inc.
MANAGEMENT’S DISCUSSION AND ANALYSIS
August 31, 2014
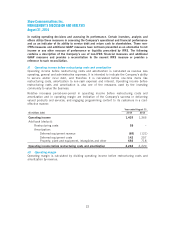
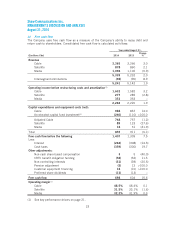
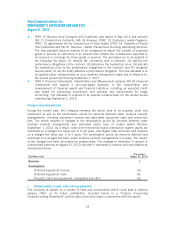
iv) Free cash flow
The Company uses free cash flow as a measure of the Company’s ability to repay debt and
return cash to shareholders. Consolidated free cash flow is calculated as follows:
Year ended August 31,
($millions Cdn) 2014 2013
Change
%
Revenue
Cable 3,365 3,266 3.0
Satellite 878 860 2.1
Media 1,096 1,106 (0.9)
5,339 5,232 2.0
Intersegment eliminations (98) (90) 8.9
5,241 5,142 1.9
Operating income before restructuring costs and amortization(1)
Cable 1,632 1,582 3.2
Satellite 277 285 (2.8)
Media 353 353 –
2,262 2,220 1.9
Capital expenditures and equipment costs (net):
Cable 988 867 14.0
Accelerated capital fund investment(1) (240) (110) >100.0
Adjusted Cable 748 757 (1.2)
Satellite 89 123 (27.6)
Media 18 31 (41.9)
Total 855 911 (6.1)
Free cash flow before the following 1,407 1,309 7.5
Less
Interest (264) (308) (14.3)
Cash taxes (359) (300) 19.7
Other adjustments:
Non-cash share-based compensation 35 (40.0)
CRTC benefit obligation funding (58) (52) 11.5
Non-controlling interests (31) (39) (20.5)
Pension adjustment (5) 12 >100.0
Customer equipment financing 18 (10) >100.0
Preferred share dividends (13) (13) –
Free cash flow 698 604 15.6
Operating margin(1)
Cable 48.5% 48.4% 0.1
Satellite 31.5% 33.1% (1.6)
Media 32.2% 31.9% 0.3
(1) See key performance drivers on page 21.
23