Shaw 2014 Annual Report Download - page 52
Download and view the complete annual report
Please find page 52 of the 2014 Shaw annual report below. You can navigate through the pages in the report by either clicking on the pages listed below, or by using the keyword search tool below to find specific information within the annual report.-
 1
1 -
2
-
3
-
4
-
5
-
6
-
7
-
8
-
9
-
10
-
11
-
12
-
13
-
14
-
15
-
16
-
17
-
18
-
19
-
20
-
21
-
22
-
23
-
24
-
25
-
26
-
27
-
28
-
29
-
30
-
31
-
32
-
33
-
34
-
35
-
36
-
37
-
38
-
39
-
40
-
41
-
 42
42 -
 43
43 -
 44
44 -
 45
45 -
 46
46 -
 47
47 -
 48
48 -
 49
49 -
 50
50 -
 51
51 -
 52
52 -
 53
53 -
 54
54 -
 55
55 -
 56
56 -
 57
57 -
 58
58 -
 59
59 -
 60
60 -
 61
61 -
 62
62 -
63
-
64
-
65
-
66
-
67
-
68
-
69
-
70
-
71
-
72
-
73
-
74
-
75
-
76
-
77
-
78
-
79
-
80
-
81
-
82
-
83
-
84
-
85
-
86
-
87
-
88
-
89
-
90
-
91
-
92
-
93
-
94
-
95
-
96
-
97
-
98
-
99
-
100
-
101
-
102
-
103
-
104
-
105
-
106
-
107
-
108
-
109
-
110
-
111
-
112
-
113
-
114
-
115
-
116
-
117
-
118
-
119
-
120
-
121
-
122
-
123
-
124
-
125
-
126
-
127
-
128
-
129
 |
 |
Shaw Communications Inc.
MANAGEMENT’S DISCUSSION AND ANALYSIS
August 31, 2014
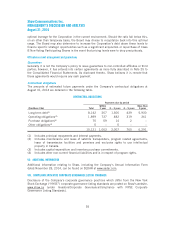
(2) Build out of mainline cable and the addition of drops in new subdivisions.
(3) Capital and equipment costs (net) related to the acquisition of new customers, including
installation of internet and digital phone modems, DCTs and commercial drops for Shaw
Business customers.
(4) Upgrades to the plant and build out of the fibre backbone.
(5) Normal replacement of aged assets such as drops, vehicles and other equipment.
(6) Amounts in 2014 and 2013 include $240 million and $110 million, respectively, related
to certain capital investments that are being funded from the accelerated capital fund.
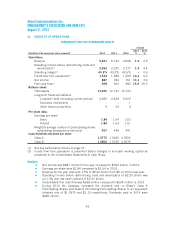
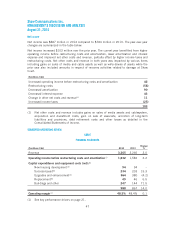
OPERATING HIGHLIGHTS
ŠRevenue and operating income before restructuring costs and amortization improved
3.0% and 3.2%, respectively, over last year.
ŠInternet customers were up 39,895 to 1,930,401 and Digital Phone lines increased
15,374 totaling 1,375,334 as at August 31, 2014. Video subscribers decreased 82,618.
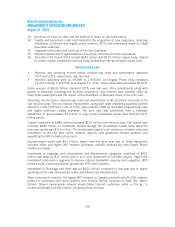
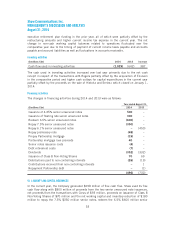
Cable revenue of $3.36 billion improved 3.0% over last year. Price adjustments along with
growth in Business, including the Envision acquisition, and Internet were partially offset by
lower Video subscribers and the impact of the divestiture of Mountain Cable in the prior year.
Operating income before restructuring costs and amortization of $1.63 billion improved 3.2%
over the prior year. The net revenue improvement, along with lower marketing expenses and the
reduction in the LPIF from 1.0% to 0.5%, were partially offset by increased programming costs
and higher employee related expenses. The prior year also benefitted from a favorable
adjustment of approximately $7 million to align certain broadcast license fees with the CRTC
billing period.
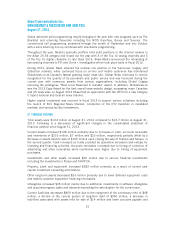
Capital investment of $988 million increased $121 million over the prior year. The current year
included $240 million of investment funded through the accelerated capital fund while the
prior year spend was $110 million. The accelerated capital fund initiatives included continued
investment on the new data centre, network capacity, next generation delivery systems, and
expediting the WiFi infrastructure build.
Success-based spend was $31 million higher than the prior year due to Video equipment
included offers and higher WiFi modem purchases, partially reduced by lower Digital Phone
modem purchases.
Investment in Upgrades and enhancement and Replacement categories combined of $413
million was lower by $13 million due to prior year investment in the DNU project. Significant
investment continued in upgrades to improve internet bandwidth capacity and congestion, WiFi
network build, business customer growth and IPTV video systems.
Investment in Buildings and other was up $103 million compared to last year due to higher
spending on the new internal data centre and Shaw Court refurbishment.
Shaw continues to invest in the largest WiFi network in Canada, now with over 45,000 hotspots
located in businesses and municipalities from Victoria, British Columbia to Sault Ste. Marie,
Ontario. Shaw’s carrier-grade network allows Shaw Internet customers, while on the go, to
access and stream internet content, including Shaw Go Apps.
48