Shaw 2014 Annual Report Download - page 108
Download and view the complete annual report
Please find page 108 of the 2014 Shaw annual report below. You can navigate through the pages in the report by either clicking on the pages listed below, or by using the keyword search tool below to find specific information within the annual report.-
 1
1 -
2
-
3
-
4
-
5
-
6
-
7
-
8
-
9
-
10
-
11
-
12
-
13
-
14
-
15
-
16
-
17
-
18
-
19
-
20
-
21
-
22
-
23
-
24
-
25
-
26
-
27
-
28
-
29
-
30
-
31
-
32
-
33
-
34
-
35
-
36
-
37
-
38
-
39
-
40
-
41
-
42
-
43
-
44
-
45
-
46
-
47
-
48
-
49
-
50
-
51
-
52
-
53
-
54
-
55
-
56
-
57
-
58
-
59
-
60
-
61
-
62
-
63
-
64
-
65
-
66
-
67
-
68
-
69
-
70
-
71
-
72
-
73
-
74
-
75
-
76
-
77
-
78
-
79
-
80
-
81
-
82
-
83
-
84
-
85
-
86
-
87
-
88
-
89
-
90
-
91
-
92
-
93
-
94
-
95
-
96
-
97
-
 98
98 -
 99
99 -
 100
100 -
 101
101 -
 102
102 -
 103
103 -
 104
104 -
 105
105 -
 106
106 -
 107
107 -
 108
108 -
 109
109 -
 110
110 -
 111
111 -
 112
112 -
 113
113 -
 114
114 -
 115
115 -
 116
116 -
 117
117 -
 118
118 -
119
-
120
-
121
-
122
-
123
-
124
-
125
-
126
-
127
-
128
-
129
 |
 |

Shaw Communications Inc.
NOTES TO CONSOLIDATED FINANCIAL STATEMENTS
August 31, 2014 and 2013
[all amounts in millions of Canadian dollars except share and per share amounts]
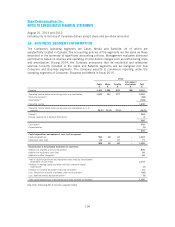
24. BUSINESS SEGMENT INFORMATION
The Company’s operating segments are Cable, Media and Satellite, all of which are
substantially located in Canada. The accounting policies of the segments are the same as those
described in the summary of significant accounting policies. Management evaluates divisional
performance based on revenue and operating income before charges such as restructuring costs
and amortization. During 2014, the Company announced that its residential and enterprise
services currently included in the Cable and Satellite segments will be realigned into new
Consumer and Business segments. The Company expects to commence reporting under the
operating segments of Consumer, Business and Media in fiscal 2015.
2014
Cable
$
Media
$
Satellite
$
Intersegment
eliminations
$
Total
$
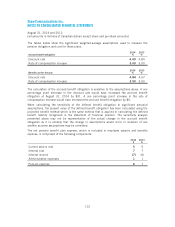
Revenue 3,365 1,096 878 (98) 5,241
Operating income before restructuring costs and amortization 1,632 353 277 – 2,262
Restructuring costs(1) (58)
Amortization(1) (765)
Operating income 1,439
Operating income before restructuring costs and amortization as % of
revenue 48.5% 32.2% 31.5% – 43.2%
Interest(1) 264
Burrard Landing Lot 2 Holdings Partnership 2
266
Cash taxes(1) 359
Corporate/other (5)
354
Capital expenditures and equipment costs (net) by segment
Capital expenditures 964 18 42 – 1,024
Equipment costs (net) 24 – 47 – 71
988 18 89 – 1,095
Reconciliation to Consolidated Statements of Cash Flows
Additions to property, plant and equipment 976
Additions to equipment costs (net) 56
Additions to other intangibles 84
Total of capital expenditures and equipment costs (net) per Consolidated
Statements of Cash Flows 1,116
Decrease in working capital and other liabilities related to capital
expenditures (7)
Decrease in customer equipment financing receivables 15
Less: Proceeds on disposal of property, plant and equipment (26)
Less: Satellite services equipment profit(2) (3)
Total capital expenditures of equipment costs (net) reported by segments 1,095
See notes following 2013 business segment table.
104