Shaw 2014 Annual Report Download - page 54
Download and view the complete annual report
Please find page 54 of the 2014 Shaw annual report below. You can navigate through the pages in the report by either clicking on the pages listed below, or by using the keyword search tool below to find specific information within the annual report.-
 1
1 -
2
-
3
-
4
-
5
-
6
-
7
-
8
-
9
-
10
-
11
-
12
-
13
-
14
-
15
-
16
-
17
-
18
-
19
-
20
-
21
-
22
-
23
-
24
-
25
-
26
-
27
-
28
-
29
-
30
-
31
-
32
-
33
-
34
-
35
-
36
-
37
-
38
-
39
-
40
-
41
-
42
-
43
-
 44
44 -
 45
45 -
 46
46 -
 47
47 -
 48
48 -
 49
49 -
 50
50 -
 51
51 -
 52
52 -
 53
53 -
 54
54 -
 55
55 -
 56
56 -
 57
57 -
 58
58 -
 59
59 -
 60
60 -
 61
61 -
 62
62 -
 63
63 -
 64
64 -
65
-
66
-
67
-
68
-
69
-
70
-
71
-
72
-
73
-
74
-
75
-
76
-
77
-
78
-
79
-
80
-
81
-
82
-
83
-
84
-
85
-
86
-
87
-
88
-
89
-
90
-
91
-
92
-
93
-
94
-
95
-
96
-
97
-
98
-
99
-
100
-
101
-
102
-
103
-
104
-
105
-
106
-
107
-
108
-
109
-
110
-
111
-
112
-
113
-
114
-
115
-
116
-
117
-
118
-
119
-
120
-
121
-
122
-
123
-
124
-
125
-
126
-
127
-
128
-
129
 |
 |

Shaw Communications Inc.
MANAGEMENT’S DISCUSSION AND ANALYSIS
August 31, 2014
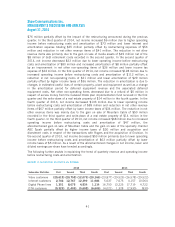
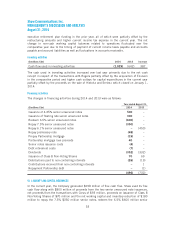
Total capital investment of $89 million for the current year declined from $123 million last
year. Success based capital was down primarily due to lower customer growth. The decrease in
Transponders reflects the final payment related to Anik G1 in the prior year while the decline in
Buildings and other relates to higher investment last year in various uplink equipment.
During the year, Shaw Direct launched a number of new HD and SD channels and currently
offers over 650 channels of which more than 220 are HD.
SUBSCRIBER STATISTICS
2014 2013 Growth
Shaw Direct customers(1) 880,623 903,565 (22,942)
(1) Including seasonal customers who temporarily suspend their service.
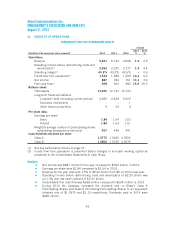
MEDIA
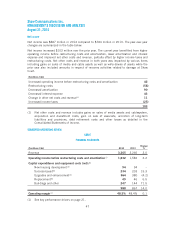
FINANCIAL HIGHLIGHTS
($millions Cdn) 2014 2013
Change
%
Revenue 1,096 1,106 (0.9)
Operating income before restructuring costs amortization(1) 353 353 –
Capital expenditures:
Broadcast and transmission 10 13 (23.1)
Buildings/other 818 (55.6)
18 31 (41.9)
Other adjustments:
CRTC benefit obligation funding (58) (52) 11.5
Non-controlling interests (31) (39) (20.5)
Operating margin(1) 32.2% 31.9% 0.3
(1) See key performance drivers on page 21.
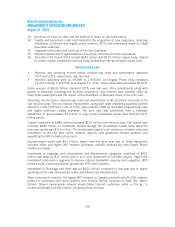
OPERATING HIGHLIGHTS
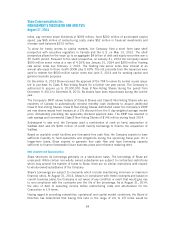
2014 revenue of $1.10 billion and operating income before restructuring costs and
amortization of $353 million compared to $1.11 billion and $353 million, respectively, for the
prior year. Revenues declined due to reduced advertising revenues and the impact of the
disposition of Historia and Series+. This was partially offset by increased subscriber and other
revenues that included a retroactive adjustment of $6 million related to Global’s share of
royalties for distant signal transmission for the years 2009 through 2013. Operating income
before restructuring costs and amortization was unchanged year-over-year as the current year
revenue decline was offset through various lower expenses including employee related and
marketing. The prior year also benefitted from a favorable adjustment of approximately $3
million to align certain broadcast license fees with the CRTC billing period.
50