Shaw 2014 Annual Report Download - page 53
Download and view the complete annual report
Please find page 53 of the 2014 Shaw annual report below. You can navigate through the pages in the report by either clicking on the pages listed below, or by using the keyword search tool below to find specific information within the annual report.-
 1
1 -
2
-
3
-
4
-
5
-
6
-
7
-
8
-
9
-
10
-
11
-
12
-
13
-
14
-
15
-
16
-
17
-
18
-
19
-
20
-
21
-
22
-
23
-
24
-
25
-
26
-
27
-
28
-
29
-
30
-
31
-
32
-
33
-
34
-
35
-
36
-
37
-
38
-
39
-
40
-
41
-
42
-
 43
43 -
 44
44 -
 45
45 -
 46
46 -
 47
47 -
 48
48 -
 49
49 -
 50
50 -
 51
51 -
 52
52 -
 53
53 -
 54
54 -
 55
55 -
 56
56 -
 57
57 -
 58
58 -
 59
59 -
 60
60 -
 61
61 -
 62
62 -
 63
63 -
64
-
65
-
66
-
67
-
68
-
69
-
70
-
71
-
72
-
73
-
74
-
75
-
76
-
77
-
78
-
79
-
80
-
81
-
82
-
83
-
84
-
85
-
86
-
87
-
88
-
89
-
90
-
91
-
92
-
93
-
94
-
95
-
96
-
97
-
98
-
99
-
100
-
101
-
102
-
103
-
104
-
105
-
106
-
107
-
108
-
109
-
110
-
111
-
112
-
113
-
114
-
115
-
116
-
117
-
118
-
119
-
120
-
121
-
122
-
123
-
124
-
125
-
126
-
127
-
128
-
129
 |
 |

Shaw Communications Inc.
MANAGEMENT’S DISCUSSION AND ANALYSIS
August 31, 2014
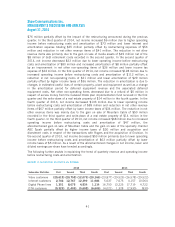
SUBSCRIBER STATISTICS
2014 2013 Growth
Change
%
VIDEO:
Connected 1,957,629 2,040,247 (82,618) (4.0)
Penetration as a % of homes passed 47.8% 50.9%
INTERNET:
Connected 1,930,401 1,890,506 39,895 2.1
Stand-alone Internet not included in video 392,387 320,724 71,663 22.3
Penetration as a % of video (excluding
Standalone Internet) 78.6% 76.9%
DIGITAL PHONE:
Number of lines(1) 1,375,334 1,359,960 15,374 1.1
(1) Represents primary and secondary lines on billing.
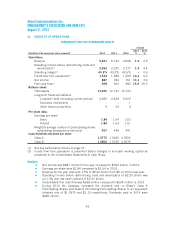
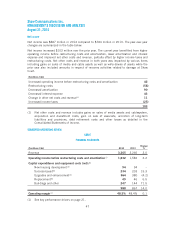
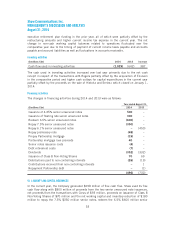
SATELLITE
FINANCIAL HIGHLIGHTS
($millions Cdn) 2014 2013
Change
%
Revenue 878 860 2.1
Operating income before restructuring costs and amortization(1) 277 285 (2.8)
Capital expenditures and equipment costs (net):
Success-based(2) 79 88 (10.2)
Transponders –23 >100.0
Buildings and other 10 12 (16.7)
89 123 (27.6)
Operating margin(1) 31.5% 33.1% (1.6)
(1) See key performance drivers on page 21.
(2) Net of the profit on the sale of satellite equipment as it is viewed as a recovery of
expenditures on customer premise equipment.
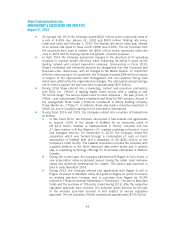
OPERATING HIGHLIGHTS
ŠRevenue improved 2.1% over the prior year to $878 million while operating income
before restructuring costs and amortization declined 2.8% to $277 million.
ŠShaw Direct subscribers decreased 22,942 to 880,623 at August 31, 2014.
Revenue of $878 million was up 2.1% over last year primarily due to rate adjustments partially
offset by customer declines. Operating income before restructuring costs and amortization of
$277 million decreased from $285 million last year primarily due revenue related
improvements offset by higher fees related to programming services and operating costs related
to the Anik G1 transponders launched in the third quarter last year. The prior year also
benefitted from a favorable adjustment of approximately $4 million to align certain broadcast
license fees with the CRTC billing period.
49