Shaw 2014 Annual Report Download - page 126
Download and view the complete annual report
Please find page 126 of the 2014 Shaw annual report below. You can navigate through the pages in the report by either clicking on the pages listed below, or by using the keyword search tool below to find specific information within the annual report.-
 1
1 -
2
-
3
-
4
-
5
-
6
-
7
-
8
-
9
-
10
-
11
-
12
-
13
-
14
-
15
-
16
-
17
-
18
-
19
-
20
-
21
-
22
-
23
-
24
-
25
-
26
-
27
-
28
-
29
-
30
-
31
-
32
-
33
-
34
-
35
-
36
-
37
-
38
-
39
-
40
-
41
-
42
-
43
-
44
-
45
-
46
-
47
-
48
-
49
-
50
-
51
-
52
-
53
-
54
-
55
-
56
-
57
-
58
-
59
-
60
-
61
-
62
-
63
-
64
-
65
-
66
-
67
-
68
-
69
-
70
-
71
-
72
-
73
-
74
-
75
-
76
-
77
-
78
-
79
-
80
-
81
-
82
-
83
-
84
-
85
-
86
-
87
-
88
-
89
-
90
-
91
-
92
-
93
-
94
-
95
-
96
-
97
-
98
-
99
-
100
-
101
-
102
-
103
-
104
-
105
-
106
-
107
-
108
-
109
-
110
-
111
-
112
-
113
-
114
-
115
-
 116
116 -
 117
117 -
 118
118 -
 119
119 -
 120
120 -
 121
121 -
 122
122 -
 123
123 -
 124
124 -
 125
125 -
 126
126 -
 127
127 -
 128
128 -
 129
129
 |
 |

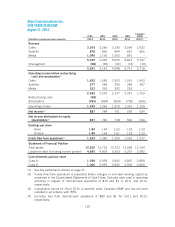
Shaw Communications Inc.
FIVE YEARS IN REVIEW
August 31, 2014
IFRS IFRS IFRS IFRS
Canadian
GAAP
($millions except per share amounts) 2014 2013 2012 2011 2010(3)
Revenue
Cable 3,365 3,266 3,193 3,096 2,932
Satellite 878 860 844 827 805
Media 1,096 1,106 1,053 891 –
5,339 5,232 5,090 4,814 3,737
Intersegment (98) (90) (92) (73) (19)
5,241 5,142 4,998 4,741 3,718
Operating income before restructuring
costs and amortization(1)
Cable 1,632 1,582 1,502 1,510 1,453
Satellite 277 285 293 289 307
Media 353 353 332 252 –
2,262 2,220 2,127 2,051 1,760
Restructuring costs (58) ––––
Amortization (765) (854) (808) (735) (656)
Operating income 1,439 1,366 1,319 1,316 1,104
Net income(4) 887 784 761 559 534
Net income attributable to equity
shareholders(4) 857 746 728 540 534
Earnings per share
Basic 1.84 1.64 1.62 1.23 1.23
Diluted 1.84 1.63 1.61 1.23 1.23
Funds flow from operations(2) 1,524 1,380 1,299 1,433 1,377
Statement of Financial Position
Total assets 13,250 12,732 12,722 12,588 10,154
Long-term debt (including current portion) 4,690 4,818 5,263 5,257 3,982
Cash dividends paid per share
Class A 1.058 0.993 0.942 0.897 0.858
Class B 1.060 0.995 0.945 0.900 0.860
(1) See key performance drivers on page 21.
(2) Funds flow from operations is presented before changes in non-cash working capital as
presented in the Consolidated Statements of Cash Flows. Excludes cash used in operating
activities in respect of discontinued operations of $10 and $1 in 2011 and 2010,
respectively.
(3) Comparative period for fiscal 2010 is reported under Canadian GAAP and has not been
restated in accordance with IFRS.
(4) Excludes loss from discontinued operations of $89 and $1 for 2011 and 2010,
respectively.
122