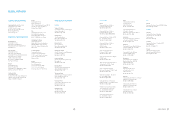
Samsung 2010 Annual Report Download - page 44
Download and view the complete annual report
Please find page 44 of the 2010 Samsung annual report below. You can navigate through the pages in the report by either clicking on the pages listed below, or by using the keyword search tool below to find specific information within the annual report.-
 1
1 -
2
-
3
-
4
-
5
-
6
-
7
-
8
-
9
-
10
-
11
-
12
-
13
-
14
-
15
-
16
-
17
-
18
-
19
-
20
-
21
-
22
-
23
-
24
-
25
-
26
-
27
-
28
-
29
-
30
-
31
-
32
-
33
-
 34
34 -
 35
35 -
 36
36 -
 37
37 -
 38
38 -
 39
39 -
 40
40 -
 41
41 -
 42
42 -
 43
43 -
 44
44 -
 45
45 -
 46
46 -
 47
47 -
 48
48
 |
 |
84 85
NOTES TO THE CONSOLIDATED FINANCIAL STATEMENTS
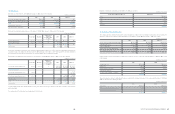
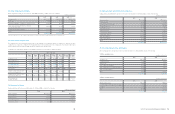
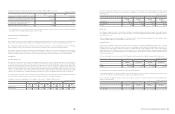
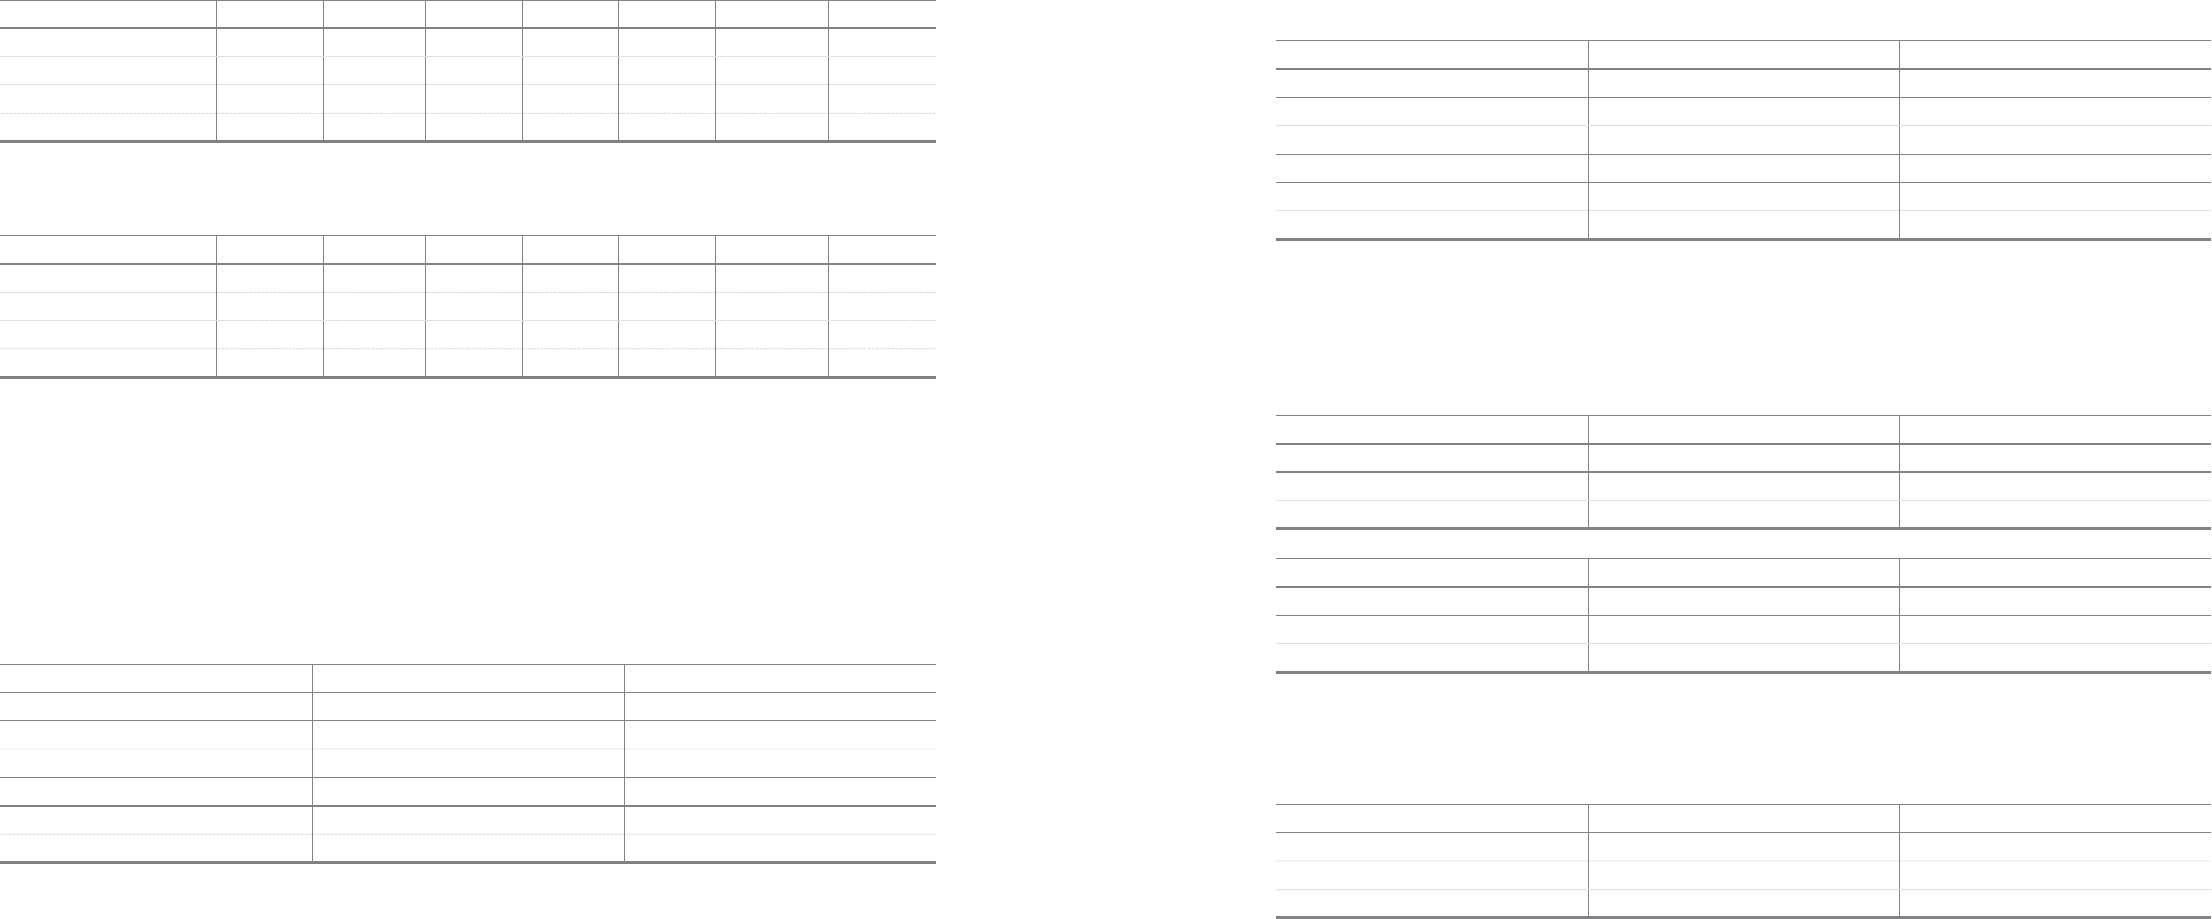
The regional segment information provided to the Management committee for the reportable segments for the year ended 31 December
2010 and 2009 is as follows:
1) Year ended 31 December 2010
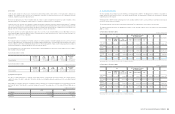
2) Year ended 31 December 2009
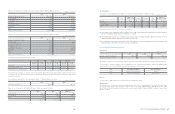
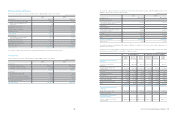
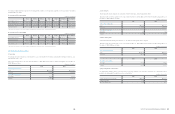
32. Related-party Transactions
1) Associates
The principal associate companies are Samsung SDI Co., Ltd., Samsung Electro-mechanics, Samsung SDS, Samsung Techwin Co., Ltd.,
and Samsung card Co., Ltd.
Transactions with associates for the years ended December 31, 2010, 2009, and the related receivables and payables as of December 31,
2010, 2009 are as follows:
(In millions of Korean Won)
(In millions of Korean Won)
1 The total of non-current assets other than financial instruments, deferred tax assets, and employment benefit.
1 The total of non-current assets other than financial instruments, deferred tax assets, and employment benefit.
Korea America Europe Asia China Eliminations Consolidated
Total segment revenue
₩
137,732,753
₩
63,898,852
₩
64,245,381
₩
33,988,191
₩
62,233,507
₩
(207,468,356
₩
154,630,328
Inter-segment revenue (111,880,989) (20,378,256) (28,115,494) (9,134,491) (37,959,126) 207,468,356 -
Revenue from external customers 25,851,764 43,520,596 36,129,887 24,853,700 24,274,381 - 154,630,328
Non-current assets1
₩
47,622,520
₩
4,926,910
₩
971,032
₩
1,062,261
₩
1,625,001
₩
(463,691)
₩
55,744,033
Korea America Europe Asia China Eliminations Consolidated
Total segment revenue
₩
110,741,944
₩
58,062,772
₩
60,805,451
₩
32,983,431
₩
57,916,110
₩
(184,186,038)
₩
136,323,670
Inter-segment revenue (88,797,775) (24,290,630) (25,608,233) (11,337,254) (34,152,146) 184,186,038 -
Revenue from external customers 21,944,169 33,772,142 35,197,218 21,646,177 23,763,964 - 136,323,670
Non-current assets1
₩
39,153,137
₩
3,002,249
₩
752,893
₩
684,465
₩
1,607,773
₩
(384,214)
₩
44,816,303
2010 2009
Inter-company transactions
Sales
₩
1,503,642
₩
1,043,837
Purchases 7,262,621 7,293,642
Receivables and payables
Receivables 183,812 152,527
Payables 816,473 1,014,765
(In millions of Korean Won)
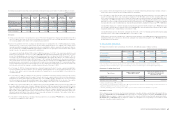
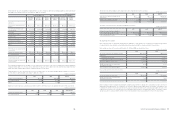
2) Joint ventures
The principal joint venture companies are Samsung Corning Precision Glass, and Samsung Siltronic Wafer.
Transactions with joint venture partners for the years ended December 31, 2010, 2009, and the related receivables and payables as of
December 31, 2010, 2009 are as follows:
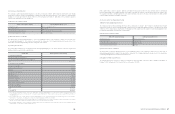
3) Other related parties
Samsung Everland and Samsung Petrochemical, etc. are defined as related parties for the company.
Transactions with other related parties for the years ended December 31, 2010, 2009, and the related receivables and payables as of
December 31, 2010, 2009 are as follows:
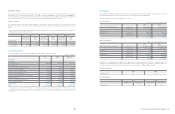
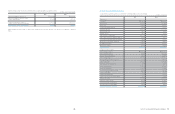
4) Key management compensation
Key management includes directors (executive and non-executive), members of the Executive Committee. The compensation paid or
payable to key management for employee services is shown below:
2010 2009
Inter-company transactions
Sales
₩
12,690
₩
47,739
Purchases 3,212,732 2,805,947
Receivables and payables
Receivables 131 950
Payables 126,906 97,322
2010 2009
Inter-company transactions
Sales
₩
598,795
₩
42,592
Purchases 478,122 310,297
2010 2009
Receivables and payables
Receivables 233,649 216,899
Payables 109,875 67,060
2010 2009
Salaries and other short-term benefits
₩
18,222
₩
12,322
Termination benefits 2,633 965
Other long-term benefits 7,634 2,807
(In millions of Korean Won)
(In millions of Korean Won)
(In millions of Korean Won)