Samsung 2010 Annual Report Download - page 18
Download and view the complete annual report
Please find page 18 of the 2010 Samsung annual report below. You can navigate through the pages in the report by either clicking on the pages listed below, or by using the keyword search tool below to find specific information within the annual report.
32 33
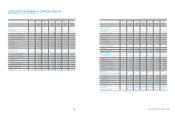
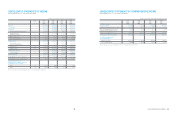
CONSOLIDATED FINANCIAL STATEMENTS
(In millions of Korean Won, in thousands of U.S dollars (Note 2.25 ))
CONSOLIDATED STATEMENTS OF INCOME
Samsung Electronics Co., Ltd. and its subsidiaries
Notes 2010 2009 2010 2009
KRW KRW USD USD
Revenue 154,630,328 136,323,670 135,771,646 119,697,664
Cost of sales 102,666,824 94,594,863 90,145,600 83,058,093
Gross profit 51,963,504 41,728,807 45,626,046 36,639,571
Research and development expenses 9,099,352 7,386,712 7,989,597 6,485,830
Selling, general and
administrative expenses 24 26,243,122 23,362,086 23,042,516 20,512,851
Other operating income 25 1,755,441 837,534 1,541,348 735,389
Other operating expenses 25 1,079,935 892,284 948,227 783,462
Operating profit 17,296,536 10,925,259 15,187,054 9,592,817
Share of profit or loss of
associates and joint ventures 2,267,091 1,713,299 1,990,597 1,504,345
Finance income 26 7,465,128 9,727,257 6,554,683 8,540,923
Finance expense 26 7,700,099 10,174,219 6,760,997 8,933,373
Profit before income tax 19,328,656 12,191,596 16,971,337 10,704,712
Income tax expense 27 3,182,131 2,431,046 2,794,039 2,134,557
Profit for the year 16,146,525 9,760,550 14,177,298 8,570,155
Profit attributable to owners of the parent 15,799,035 9,571,598 13,872,188 8,404,248
Profit attributable to non-controlling interest 347,490 188,952 305,110 165,907
Earnings per share for profit
attributable to the owners of the parent
(In Korean Won and US dollars):
Basic 28 105,992 64,888 93.07 56.97
Diluted 28 105,672 64,586 92.78 56.71
The accompanying notes are an integral part of these consolidated financial statements.
CONSOLIDATED STATEMENTS OF COMPREHENSIVE INCOME
Samsung Electronics Co., Ltd. and its subsidiaries
(In millions of Korean Won, in thousands of U.S dollars (Note 2.25))
2010 2009 2010 2009
KRW KRW USD USD
Profit for the period 16,146,525 9,760,550 14,177,298 8,570,155
Available-for-sale financial assets, net of tax 932,384 108,217 818,671 95,019
Share of other comprehensive income of
associates and joint ventures, net of tax 387,457 49,879 340,203 43,796
Foreign currency translation, net of tax (178,357) (819,802) (156,605) (719,819)
Consolidated comprehensive income 17,288,009 9,098,844 15,179,567 7,989,151
Consolidated comprehensive
income attributable to:
Owners of the parent 16,901,117 9,060,689 14,839,860 7,955,649
Non-controlling interests 386,892 38,155 339,707 33,502
The accompanying notes are an integral part of these consolidated financial statements.


