Samsung 2010 Annual Report Download - page 40
Download and view the complete annual report
Please find page 40 of the 2010 Samsung annual report below. You can navigate through the pages in the report by either clicking on the pages listed below, or by using the keyword search tool below to find specific information within the annual report.-
 1
1 -
2
-
3
-
4
-
5
-
6
-
7
-
8
-
9
-
10
-
11
-
12
-
13
-
14
-
15
-
16
-
17
-
18
-
19
-
20
-
21
-
22
-
23
-
24
-
25
-
26
-
27
-
28
-
29
-
 30
30 -
 31
31 -
 32
32 -
 33
33 -
 34
34 -
 35
35 -
 36
36 -
 37
37 -
 38
38 -
 39
39 -
 40
40 -
 41
41 -
 42
42 -
 43
43 -
 44
44 -
 45
45 -
 46
46 -
 47
47 -
 48
48
 |
 |
76 77
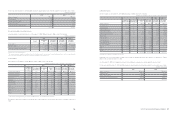
NOTES TO THE CONSOLIDATED FINANCIAL STATEMENTS
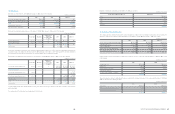
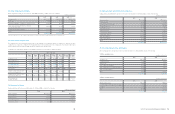
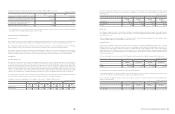
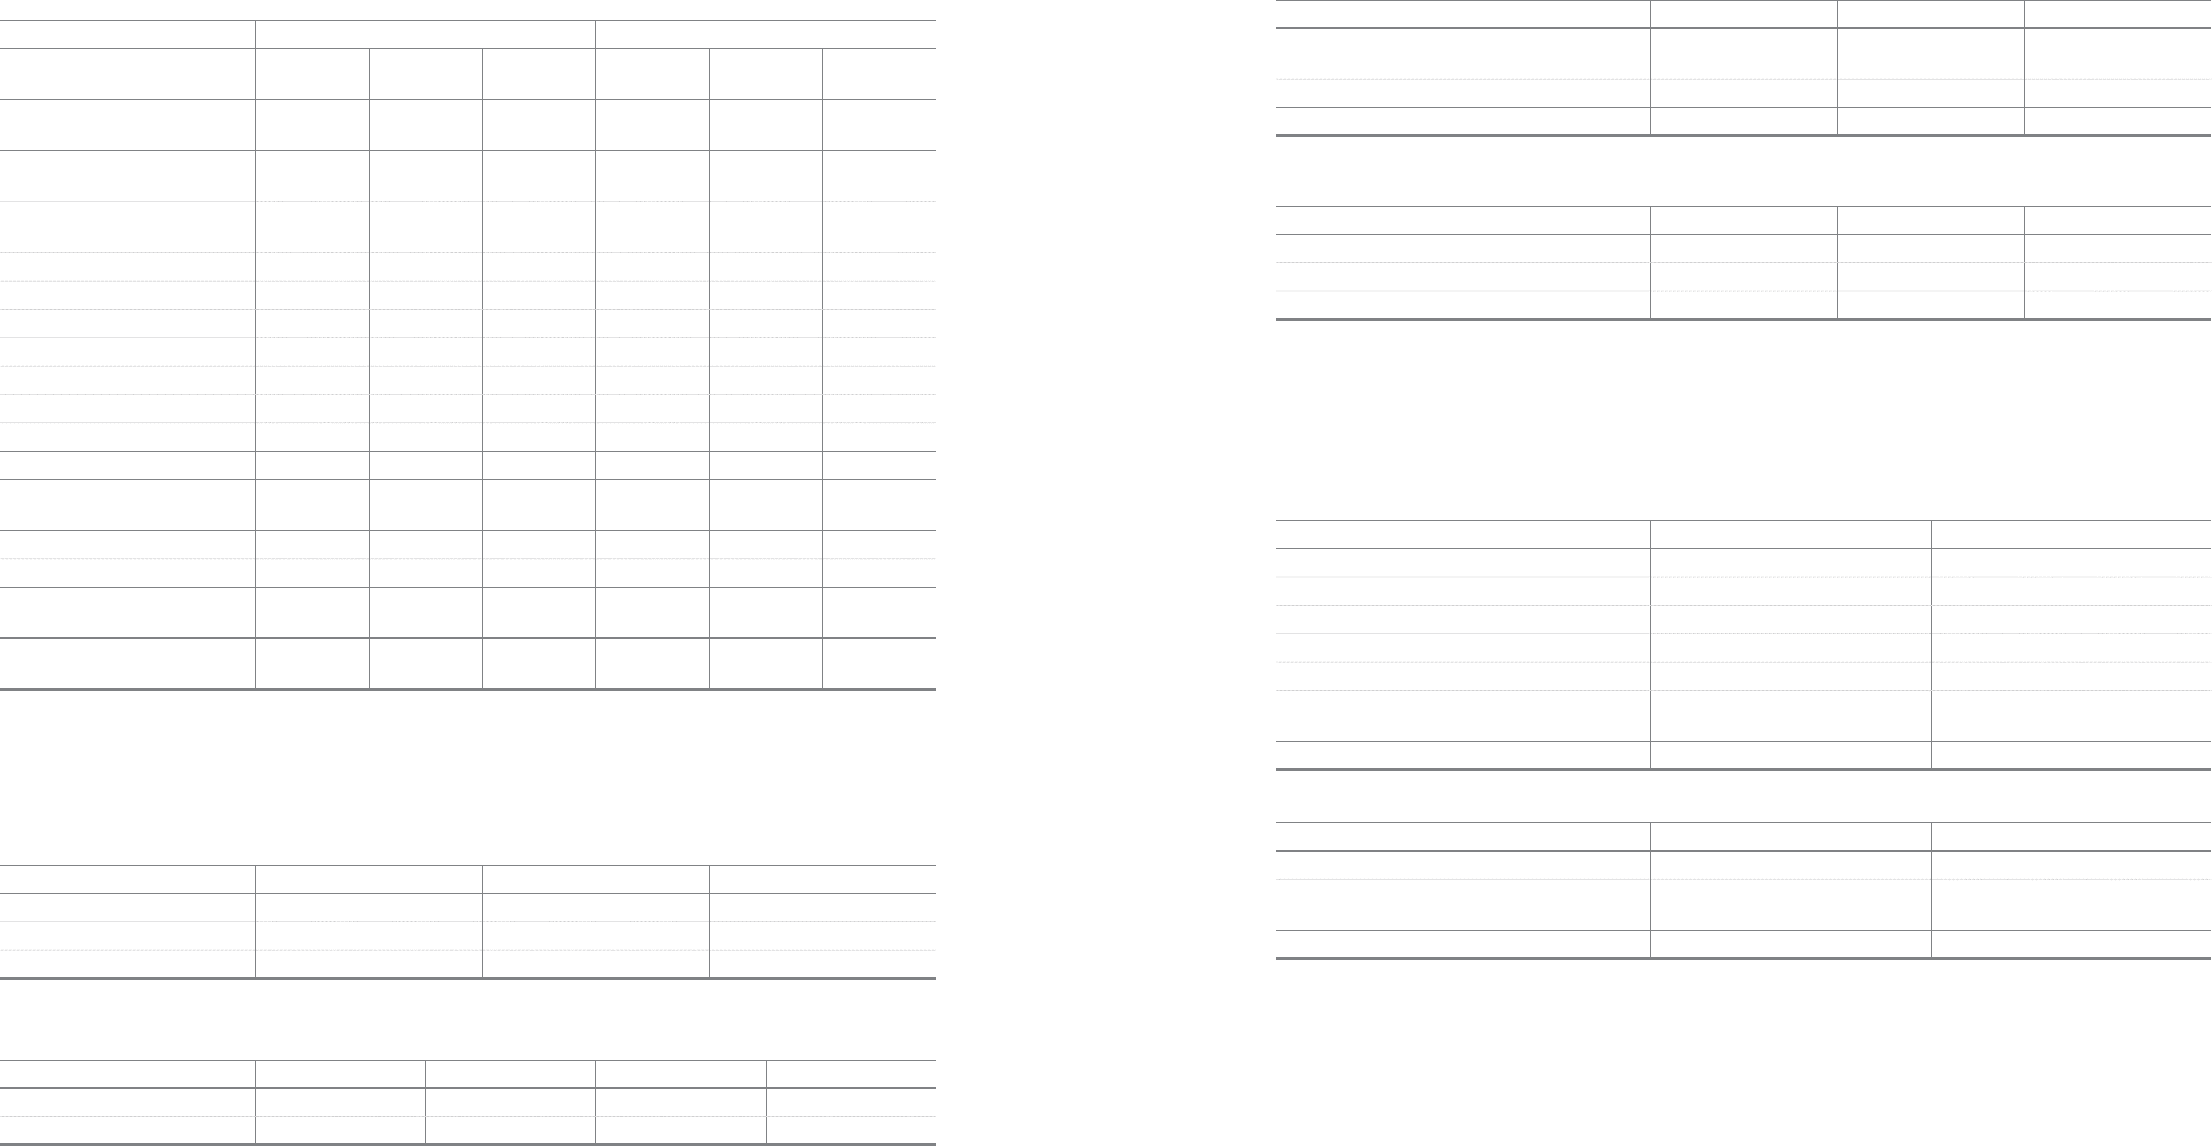
Deferred income tax assets and liabilities resulting from the tax effect of temporary differences including available tax credit carryforwards
and undisposed accumulated deficit as of December 31, 2009, are as follows:
The Company periodically assesses its ability to recover deferred income tax assets. In the event of a significant uncertainty regarding the
Company’s ultimate ability to recover such assets, deferred income tax assets are recognized only to the extent that it is probable that future
taxable profit will be available against which the temporary differences can be utilized.
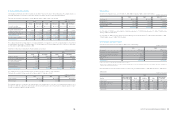
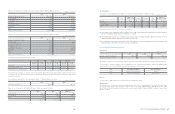
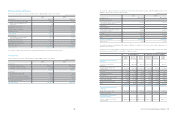
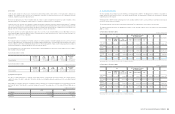
Temporary differences, whose deferred tax effects were not recognized due to the uncertainty regarding ultimate realizability of such assets,
as of December 31, 2010 and 2009, and January 1, 2009, are as follows:
Expiry date of unused tax losses, and unused tax credits for which no deferred tax asset is recognized in the balance sheet are as follows:
(In millions of Korean Won)
Temporary differences Deferred income tax asset (Liabilities)
Beginning
balance
Increase
(Decrease)
Ending
balance
Beginning
balance
Increase
(Decrease)
Ending
balance
Deferred tax arising from temporary
differences
Special reserves appropriated for tax
purposes
₩
(1,282,294)
₩
637,483
₩
(644,811)
₩
(296,129)
₩
140,085
₩
(156,044)
Associates and joint ventures and
other investments (5,222,534) (3,809,948) (9,032,482) (1,062,810) (518,936) (1,581,746)
Depreciation (68,879) 32,049 (36,830) (55,939) 1,004 (54,935)
Capitalized interest expense (44,027) 2,365 (41,662) (8,646) (699) (9,345)
Accrued income (223,605) 184,037 (39,568) (54,064) 44,488 (9,576)
Allowance (Technical expense, others) 3,255,634 563,440 3,819,074 825,490 124,794 950,284
Foreign currency translation 353,637 (275,814) 77,823 85,224 (67,712) 17,512
Impairment losses on investments 43,515 (9,120) 34,395 9,574 (2,006) 7,568
Others (3,003,119) 587,710 (2,415,409) (489,112) 152,496 (336,616)
₩
(6,191,672)
₩
(2,087,798)
₩
(8,279,470)
₩
(1,046,412)
₩
(126,486)
₩
(1,172,898)
Deferred tax assets arising from the
carryforwards
Undisposed accumulated deficit
₩
541,659
₩
(256,091)
₩
285,568
₩
101,728
₩
(56,116)
₩
45,612
Tax credit carryforwards 1,180,587 168,034 1,348,621 933,544 122,990 1,056,534
Deferred items recognized in other
comprehensive income
Valuation of available-for-sale financial
assets and others
₩
(1,500,634)
₩
643,834
₩
(856,800)
₩
(169,566)
₩
41,955
₩
(127,611)
2010 2009 2009.1.1
Undisposed accumulated deficit
₩
37,803
₩
99,497
₩
142,658
Tax credit carryforwards 131,782 381,534 305,227
Others - 53,657 50,182
2011 2012 2013 2014 and after
Undisposed accumulated deficit
₩
-
₩
-
₩
-
₩
37,803
Tax credit carryforwards 11,391 65,612 7,662 47,117
(In millions of Korean Won)
(In millions of Korean Won)
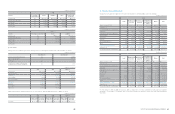
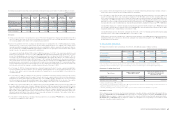
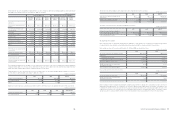
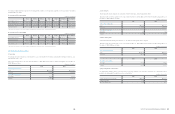
The amount of income tax relating to each component of other comprehensive income is as follows:
The analysis of deferred tax assets and deferred tax liabilities is as follows:
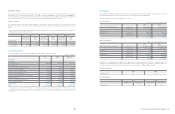
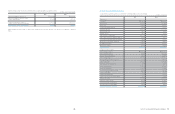
28. Earnings Per Share
Basic earnings per share is calculated by dividing the profit attributable to equity holders of the company by the weighted average number
of ordinary shares in issue during the year excluding ordinary shares purchased by the company and held as treasury shares.
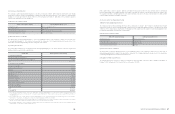
Basic earnings per share for the years ended December 31, 2010 and 2009, are calculated as follows:
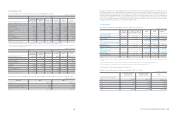
Diluted earnings per share is calculated by adjusting the weighted average number of ordinary shares outstanding to assume conversion of
all dilutive potential ordinary shares. The company has one category of dilutive potential ordinary shares: Stock options. A calculation is done
to determine the number of shares that could have been acquired at fair value (determined as the average annual market share price of the
company’s shares) based on the monetary value of the subscription rights attached to outstanding share options. The number of shares
calculated as above is compared with the number of shares that would have been issued assuming the exercise of the share options.
2010 2009 2009.1.1
Gain and loss on valuation of available-for-sale
financial assets
₩
(449,408)
₩
(192,914)
₩ ( 169 , 56 6)
Foreign currency translation adjustment 25,287 65,303 -
₩
(424,121)
₩
(127,611)
₩
(169,566)
2010 2009 2009.1.1
Deferred tax asset and deferred tax liabilities:
to be recovered after more than 12 months
₩
(3,315,386)
₩
(2,482,155)
₩
(2,233,685)
to be recovered within 12 months 2,786,728 2,283,792 2,052,979
2010 2009
Net income as reported on the statements of income
₩
15,799,035
₩
9,571,598
Adjustments:
Dividends for preferred stock1(199,530) (159,823)
Undeclared participating preferred stock dividend1(1,896,887) (1,124,027)
Net income available for common stock 13,702,618 8,287,748
Weighted-average number of common shares
Outstanding (In thousands) 129,280 127,724
Basic earnings per share (In Korean Won)
₩
105,992
₩
64,888
(In millions of Korean Won)
(In millions of Korean Won)
(In millions of Korean Won)
2010 2009
Net income available for preferred stock
₩
2,096,417
₩
1,283,850
Weighted-average number of preferred shares
Outstanding (In thousands) 19,854 19,854
Basic earnings per preferred share (In Korean Won)
₩
105,592
₩
64,665
(In millions of Korean Won)
1 Basic earnings per preferred share (In Korean Won)