Samsung 2010 Annual Report Download - page 19
Download and view the complete annual report
Please find page 19 of the 2010 Samsung annual report below. You can navigate through the pages in the report by either clicking on the pages listed below, or by using the keyword search tool below to find specific information within the annual report.
34 35
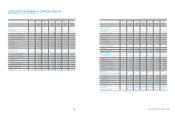
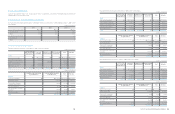
CONSOLIDATED FINANCIAL STATEMENTS
(In millions of Korean Won)
CONSOLIDATED STATEMENTS OF CHANGES IN EQUITY
Samsung Electronics Co., Ltd. and its subsidiaries
2009 KRW Preferred
stock
Common
stock
Share
premium
Retained
earnings
Other
reserves
Equity
attributable
to owners of
the parent
Non-
controlling
interests
Total
Balance at January 1, 2009 119,467 778,047 4,403,893 62,281,216 (6,607,692) 60,974,931 2,485,454 63,460,385
Profit for the period - - - 9,571,598 - 9,571,598 188,952 9,760,550
Available-for-sale
financial assets, net of tax ----106,208 106,208 2,009 108,217
Share of other comprehensive
income of associates and joint
ventures, net of tax
----49,879 49,879 - 49,879
Foreign currency translation,
net of tax ----(745,835) (745,835) (73,967) (819,802)
Total comprehensive income - - - 9,571,598 (589,748) 8,981,850 116,994 9,098,844
Dividends - - - (808,948) - (808,948) (14,678) (823,626)
Change in ownership interests,
including new stock issues by
consolidated subsidiaries
----52,356 52,356 163,589 215,945
Effect of business combinations ----- 722,285 722,285
Disposal of treasury stock ----504,031 504,031 - 504,031
Stock option activities ----(172,874) (172,874) - (172,874)
Others - - - 21,381 12,326 33,707 6,505 40,212
Total transactions with owners - - - (787,567) 395,839 (391,728) 877,701 485,973
Balance at December 31, 2009 119,467 778,047 4,403,893 71,065,247 (6,801,601) 69,565,053 3,480,149 73,045,202
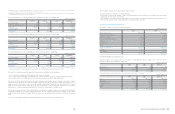
(In thousands of U.S dollars (Note 2.25))
2009 USD Preferred
stock
Common
stock
Share
premium
Retained
earnings
Other
reserves
Equity
attributable
to owners of
the parent
Non-
controlling
interests
Total
Balance at January 1, 2009 104,897 683,157 3,866,795 54,685,412 (5,801,819) 53,538,442 2,182,329 55,720,771
Profit for the period - - - 8,404,248 - 8,404,248 165,907 8,570,155
Available-for-sale
financial assets, net of tax ----93,255 93,255 1,764 95,019
Share of other comprehensive
income of associates and joint
ventures, net of tax
----43,796 43,796 - 43,796
Foreign currency translation,
net of tax ----(654,873) (654,873) (64,946) (719,819)
Total comprehensive income - - - 8,404,248 (517,822) 7,886,426 102,725 7,989,151
Dividends - - - (710,289) - (710,289) (12,888) (723,177)
Change in ownership interests,
including new stock issues by
consolidated subsidiaries
----45,971 45,971 143,638 189,609
Effect of business combinations ----- -634,195 634,195
Disposal of treasury stock ----442,559 442,559 - 442,559
Stock option activities ----(151,790) (151,790) - (151,790)
Others - - - 18,773 10,823 29,596 5,712 35,308
Total transactions with owners - - - (691,516) 347,563 (343,953) 770,657 426,704
Balance at December 31, 2009 104,897 683,157 3,866,795 62,398,144 (5,972,078) 61,080,915 3,055,711 64,136,626


