Samsung 2010 Annual Report Download - page 39
Download and view the complete annual report
Please find page 39 of the 2010 Samsung annual report below. You can navigate through the pages in the report by either clicking on the pages listed below, or by using the keyword search tool below to find specific information within the annual report.-
 1
1 -
2
-
3
-
4
-
5
-
6
-
7
-
8
-
9
-
10
-
11
-
12
-
13
-
14
-
15
-
16
-
17
-
18
-
19
-
20
-
21
-
22
-
23
-
24
-
25
-
26
-
27
-
28
-
 29
29 -
 30
30 -
 31
31 -
 32
32 -
 33
33 -
 34
34 -
 35
35 -
 36
36 -
 37
37 -
 38
38 -
 39
39 -
 40
40 -
 41
41 -
 42
42 -
 43
43 -
 44
44 -
 45
45 -
 46
46 -
 47
47 -
 48
48
 |
 |
74 75
NOTES TO THE CONSOLIDATED FINANCIAL STATEMENTS
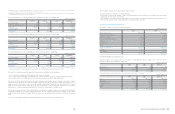
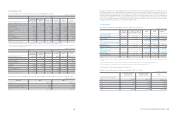
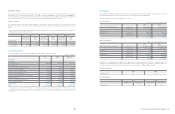
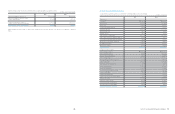
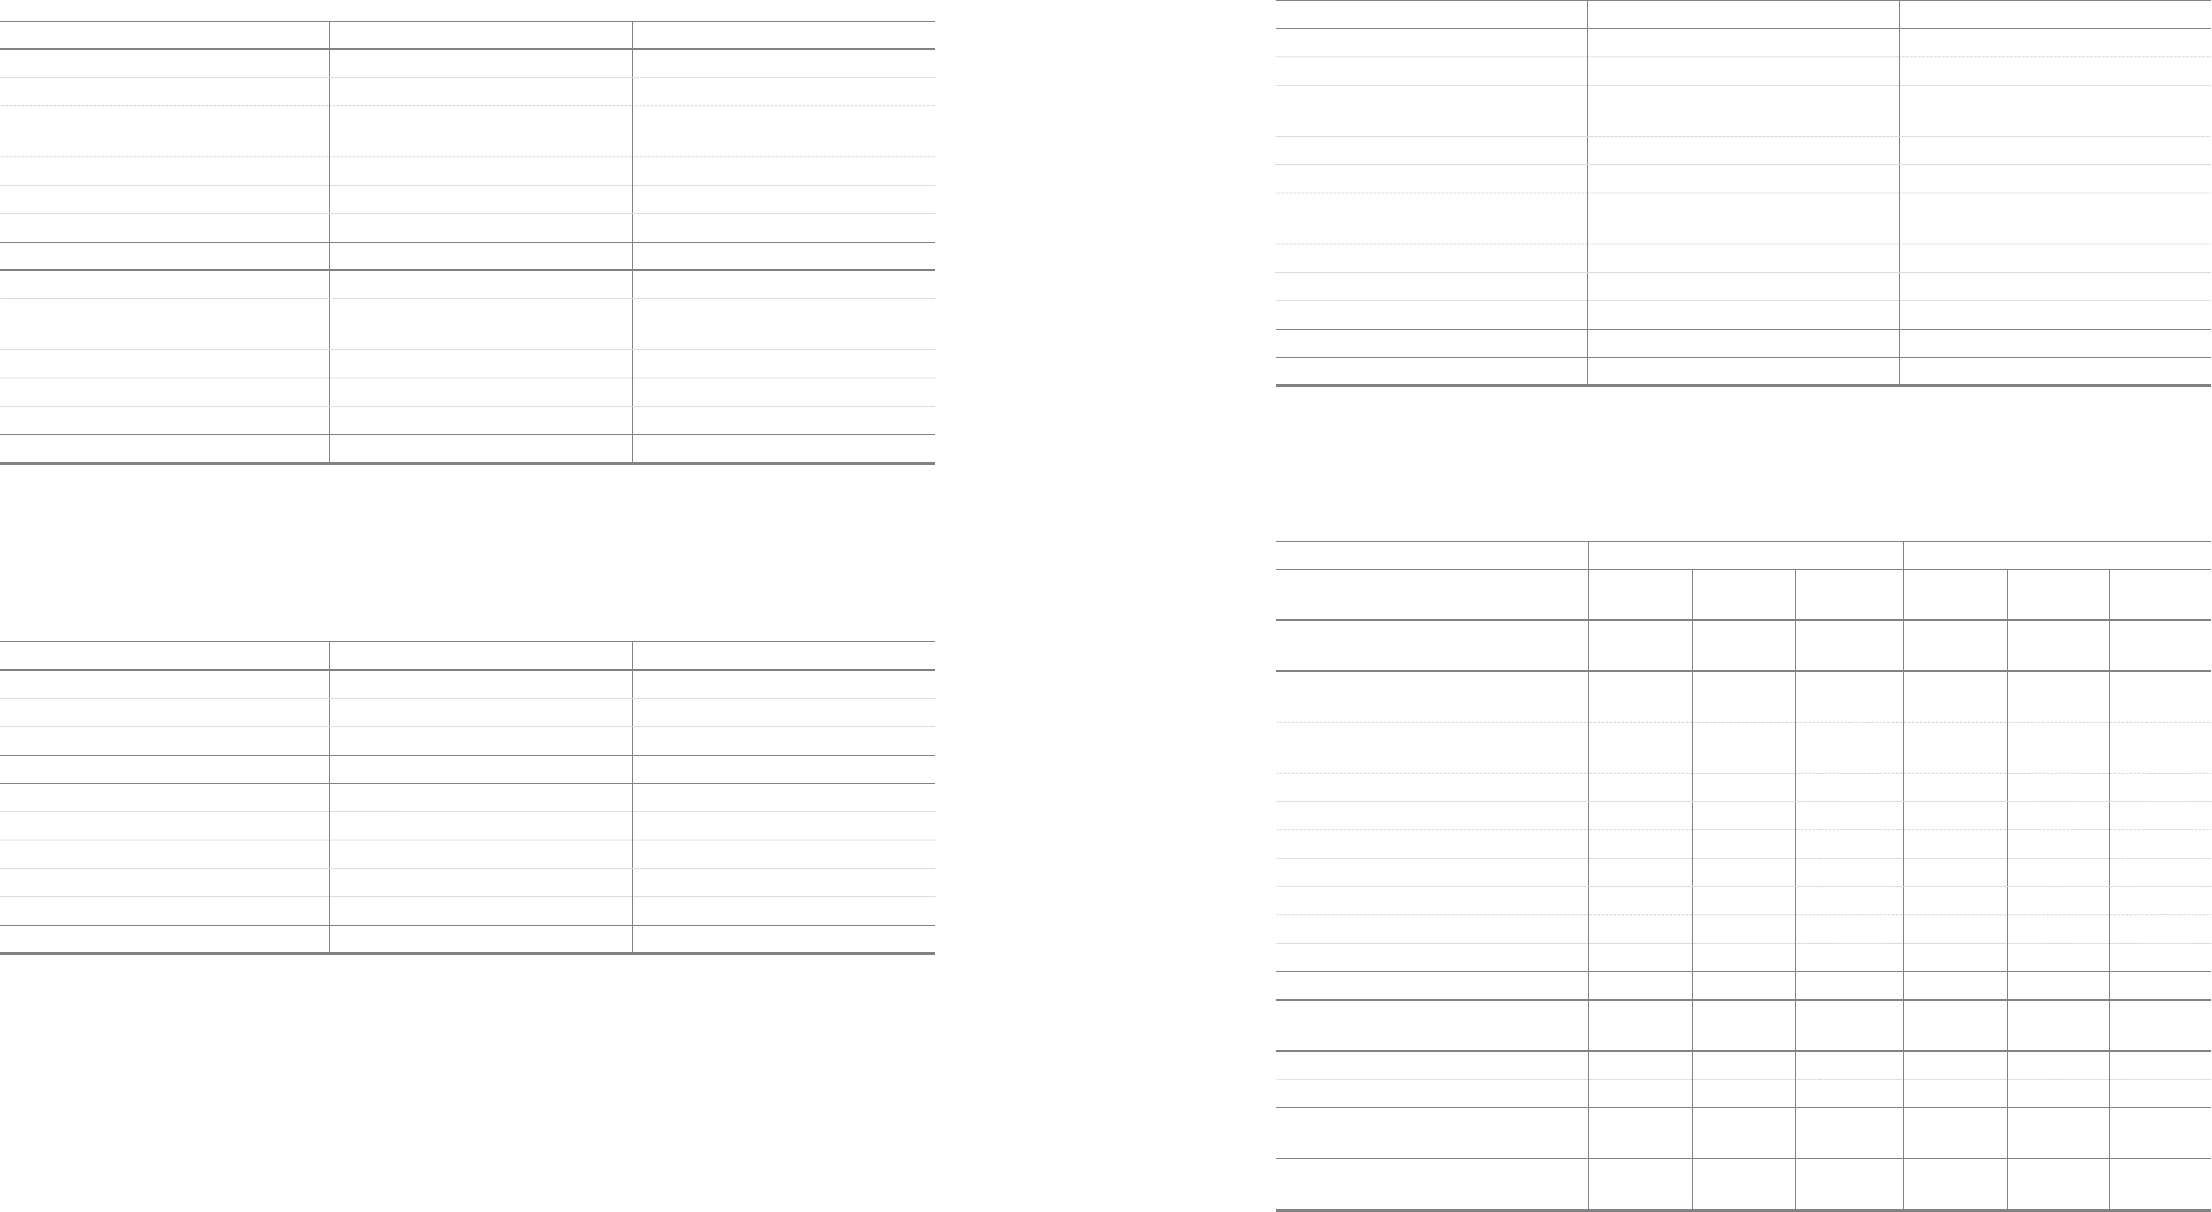
26. Finance Income and Expenses
Finance income and expenses for the years ended December 31, 2010 and 2009, consists of the following:
The company recognizes the profits and losses regarding translation differences as financial income and expenses.
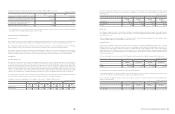
27. Income Tax
Income tax expense for the years ended December 31, 2010 and 2009, consists of the following:
2010 2009
Interest income
₩
558,113
₩
361,006
Interest income from loans and receivables 556,624 360,962
Interest income from available-for-sale
financial assets 1,489 44
Realized foreign exchange gains 6,012,626 7,699,429
Unrealized foreign exchange gains 496,543 1,322,525
Other finance income 397,846 344,297
Finance income 7,465,128 9,727,257
Interest expense: 581,091 535,287
Interest expense from financial liabilities
measured at amortized cost 581,091 535,287
Realized foreign exchange losses 6,274,744 8,154,318
Unrealized foreign exchange losses 414,077 1,054,144
Other finance expenses 430,187 430,470
Finance expenses
₩
7,700,099
₩
10,174,219
2010 2009
Current taxes:
Current tax on profits for the year
₩
3,330,420
₩
1,947,943
Adjustments in respect of prior years (163,739) 124,259
3,166,681 2,072,202
Deferred taxes:
Deferred income taxes-tax credit (363,802) 30,603
Deferred income taxes-temporary difference 341,137 250,637
Deferred income taxes-accumulated operating loss 41,036 74,610
Items charged directly to equity (2,921) 2,994
Income tax expense
₩
3,182,131
₩
2,431,046
(In millions of Korean Won)
(In millions of Korean Won)
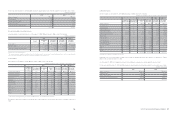
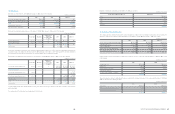
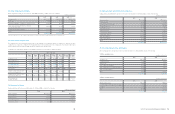
The tax on the company’s profit before tax differs from the theoretical amount that would arise using the weighted average tax rate
applicable to profits of the consolidated entities as follows:
The weighted average tax rate declined in 2010 compared to 2009 due to changes of the tax rates in certain countries, primarily due to a
reduction in tax rates in Korea.
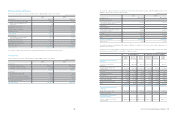
Deferred income tax assets and liabilities resulting from the tax effect of temporary differences including available tax credit carryforwards
and undisposed accumulated deficit as of December 31, 2010, are as follows:
2010 2009
Income before tax
₩
19,328,656
₩
12,191,596
Weighted average tax rate
Tax calculated at domestic tax rates applicable
to profits in the respective countries 4,712,450 2,900,059
Tax effects of:
Permanent difference (126,283) (74,873)
Temporary differences for which no deferred
income tax was recognized (88,469) (142,395)
Tax credit (1,887,582) (801,854)
Overseas subsidiaries and associates operations 527,553 518,936
Other 44,462 31,173
Actual income tax expense
₩
3,182,131
₩
2,431,046
Effective tax rate 16.5% 19.9%
(In millions of Korean Won)
(In millions of Korean Won)
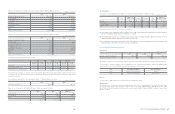
Temporary differences Deferred income tax asset (Liabilities)
Beginning
balance
Increase
(Decrease)
Ending
balance
Beginning
balance
Increase
(Decrease)
Ending
balance
Deferred tax arising from temporary
differences
Special reserves appropriated for
tax purposes
₩
(644,811)
₩
626,665
₩
(18,146)
₩
(156,044)
₩
152,052
₩
(3,992)
Associates and joint ventures and
other investments (9,032,482) (5,127,725) (14,160,207) (1,581,746) (527,553) (2,109,299)
Depreciation (36,830) 167,226 130,396 (54,935) 45,610 (9,325)
Capitalized interest expense (41,662) 1,795 (39,867) (9,345) 535 (8,810)
Accrued income (39,568) (105,053) (144,621) (9,576) (25,354) (34,930)
Allowance (Technical expense, others) 3,819,074 (76,731) 3,742,343 950,284 (23,571) 926,713
Foreign currency translation 77,823 (100,845) (23,022) 17,512 (24,080) (6,568)
Impairment losses on investments 34,395 11,025 45,420 7,568 2,426 9,994
Others (2,415,409) 478,961 (1,936,448) (336,616) 43,498 (293,118)
₩
(8,279,470)
₩
(4,124,682)
₩
(12,404,152)
₩
(1,172,898)
₩
(356,437)
₩
(1,529,335)
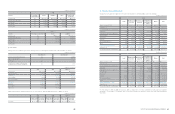
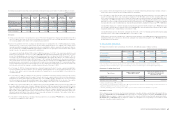
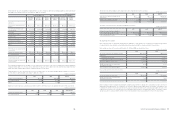
Deferred tax assets arising from the
carryforwards
Undisposed accumulated deficit
₩
285,568
₩
(244,746)
₩
40,822
₩
45,612
₩
(41,250)
₩
4,362
Tax credit carryforwards 1,348,621 233,204 1,581,825 1,056,534 363,902 1,420,436
Deferred items recognized in other
comprehensive income
Valuation of available-for-sale financial
assets and others
₩
(856,800)
₩
(1,417,671)
₩ (
2,274,471)
₩
(127,611)
₩
(296,510)
₩
(424,121)