Samsung 2010 Annual Report Download - page 31
Download and view the complete annual report
Please find page 31 of the 2010 Samsung annual report below. You can navigate through the pages in the report by either clicking on the pages listed below, or by using the keyword search tool below to find specific information within the annual report.-
 1
1 -
2
-
3
-
4
-
5
-
6
-
7
-
8
-
9
-
10
-
11
-
12
-
13
-
14
-
15
-
16
-
17
-
18
-
19
-
20
-
 21
21 -
 22
22 -
 23
23 -
 24
24 -
 25
25 -
 26
26 -
 27
27 -
 28
28 -
 29
29 -
 30
30 -
 31
31 -
 32
32 -
 33
33 -
 34
34 -
 35
35 -
 36
36 -
 37
37 -
 38
38 -
 39
39 -
 40
40 -
 41
41 -
42
-
43
-
44
-
45
-
46
-
47
-
48
 |
 |
58 59
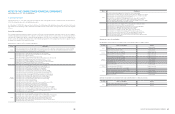
NOTES TO THE CONSOLIDATED FINANCIAL STATEMENTS
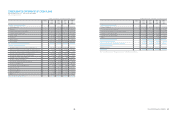
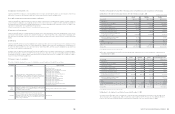
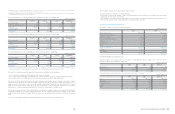
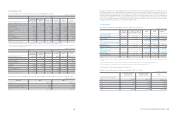
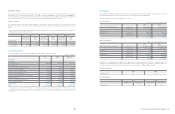
8. Trade and Other Receivables
Substantially all current trade and other receivables are due within 1 year from the end of the reporting period. The carrying amount is a
reasonable approximation of fair value for current trade and other receivables, with effect of discount being insignificant.
Trade and other receivables of December 31, 2010, 2009 and January 1, 2009, consist of the following:
The Company transferred receivable balances to financial institutions in exchange for cash. The outstanding balance of transferred
receivable balances amounting to
5,090,433 million,
5,355,185 million and
5,533,419 million has been accounted for as borrowings
as of December 31, 2010, 2009 and January 1, 2009.
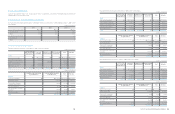
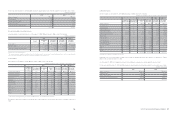
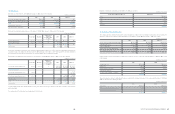
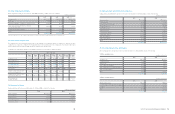
Movements on the provision for impairment of trade receivables are as follows:
The company does not consider receivables that are overdue for less than or equal to 31 days as impaired.
Trade and other receivables that are overdue for less than or equal to 31 days are as follows:
The maximum exposure to credit risk at the reporting date is the carrying value of each class of receivable mentioned above. As of
December 31, 2010, the Company has credit insurance with Korea Trade Insurance and overseas insurance companies against its export
accounts receivables from approved foreign customers.
2010 2009 2009. 1. 1
Trade Non-trade Trade Non-trade Trade Non-trade
Receivables excluding
associates and joint ventures
₩
19,277,300
₩
2,171,115
₩
17,926,719
₩
2,049,336
₩
13,915,906
₩
1,524,129
Receivables related toassociated
companies and joint ventures 61,587 8,638 43,788 10,293 42,560 31,484
Less: Allowances for impairment (185,758) (19,585) (129,078) (26,510) (89,987) (30,816)
Trade receivables, net
₩
19,153,129
₩
2,160,168
₩
17,841,429
₩
2,033,119
₩
13,868,479
₩
1,524,797
Less: Non-current receivables (15) (4,448) (22,689) (55,080) (17,158) (9,574)
Current receivables
₩
19,153,114
₩
2,155,720
₩
17,818,740
₩
1,978,039
₩
13,851,321
₩
1,515,223
(In millions of Korean Won)
2010 2009
Trade Non-trade Trade Non-trade
Balance on January 1
₩
(129,078)
₩
(26,510)
₩
(89,987)
₩
(30,816)
Provision for receivables impairment (100,912) (10,561) (97,203) (5,565)
Receivables written off during
the year as uncollectible 10,909 10,668 31,108 5,700
Unused amounts reversed 32,062 7,776 24,246 3,520
Translation difference 1,261 (958) 2,758 651
Balance on December 31
₩
(185,758)
₩
(19,585)
₩
(129,078)
₩
(26,510)
2010 2009 2009. 1. 1
Trade receivables
₩
1,065,603
₩
1,078,189
₩
1,261,800
Other receivables 93,326 58,251 73,714
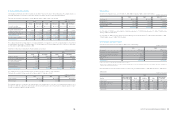
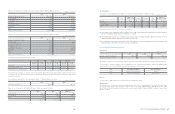
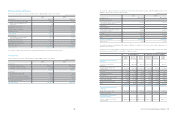
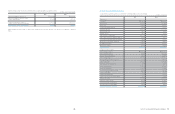
9. Inventories
Inventories, net of valuation losses, as of December 31, 2010, 2009 and January, 1 2009, consist of the following:
As of December 31, 2010, losses from valuation of inventories amounted to
524,850 million (December 31, 2009:
369,033 million,
January 1, 2009:
651,085 million).
As of December 31, 2010, losses from obsolescence and scrappage of inventories amounted to
1,284,956 million (December 31, 2009:
458,826 million, January 1, 2009:
506,319 million).
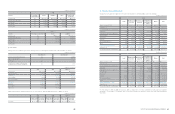
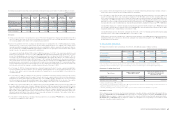
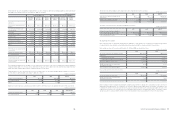
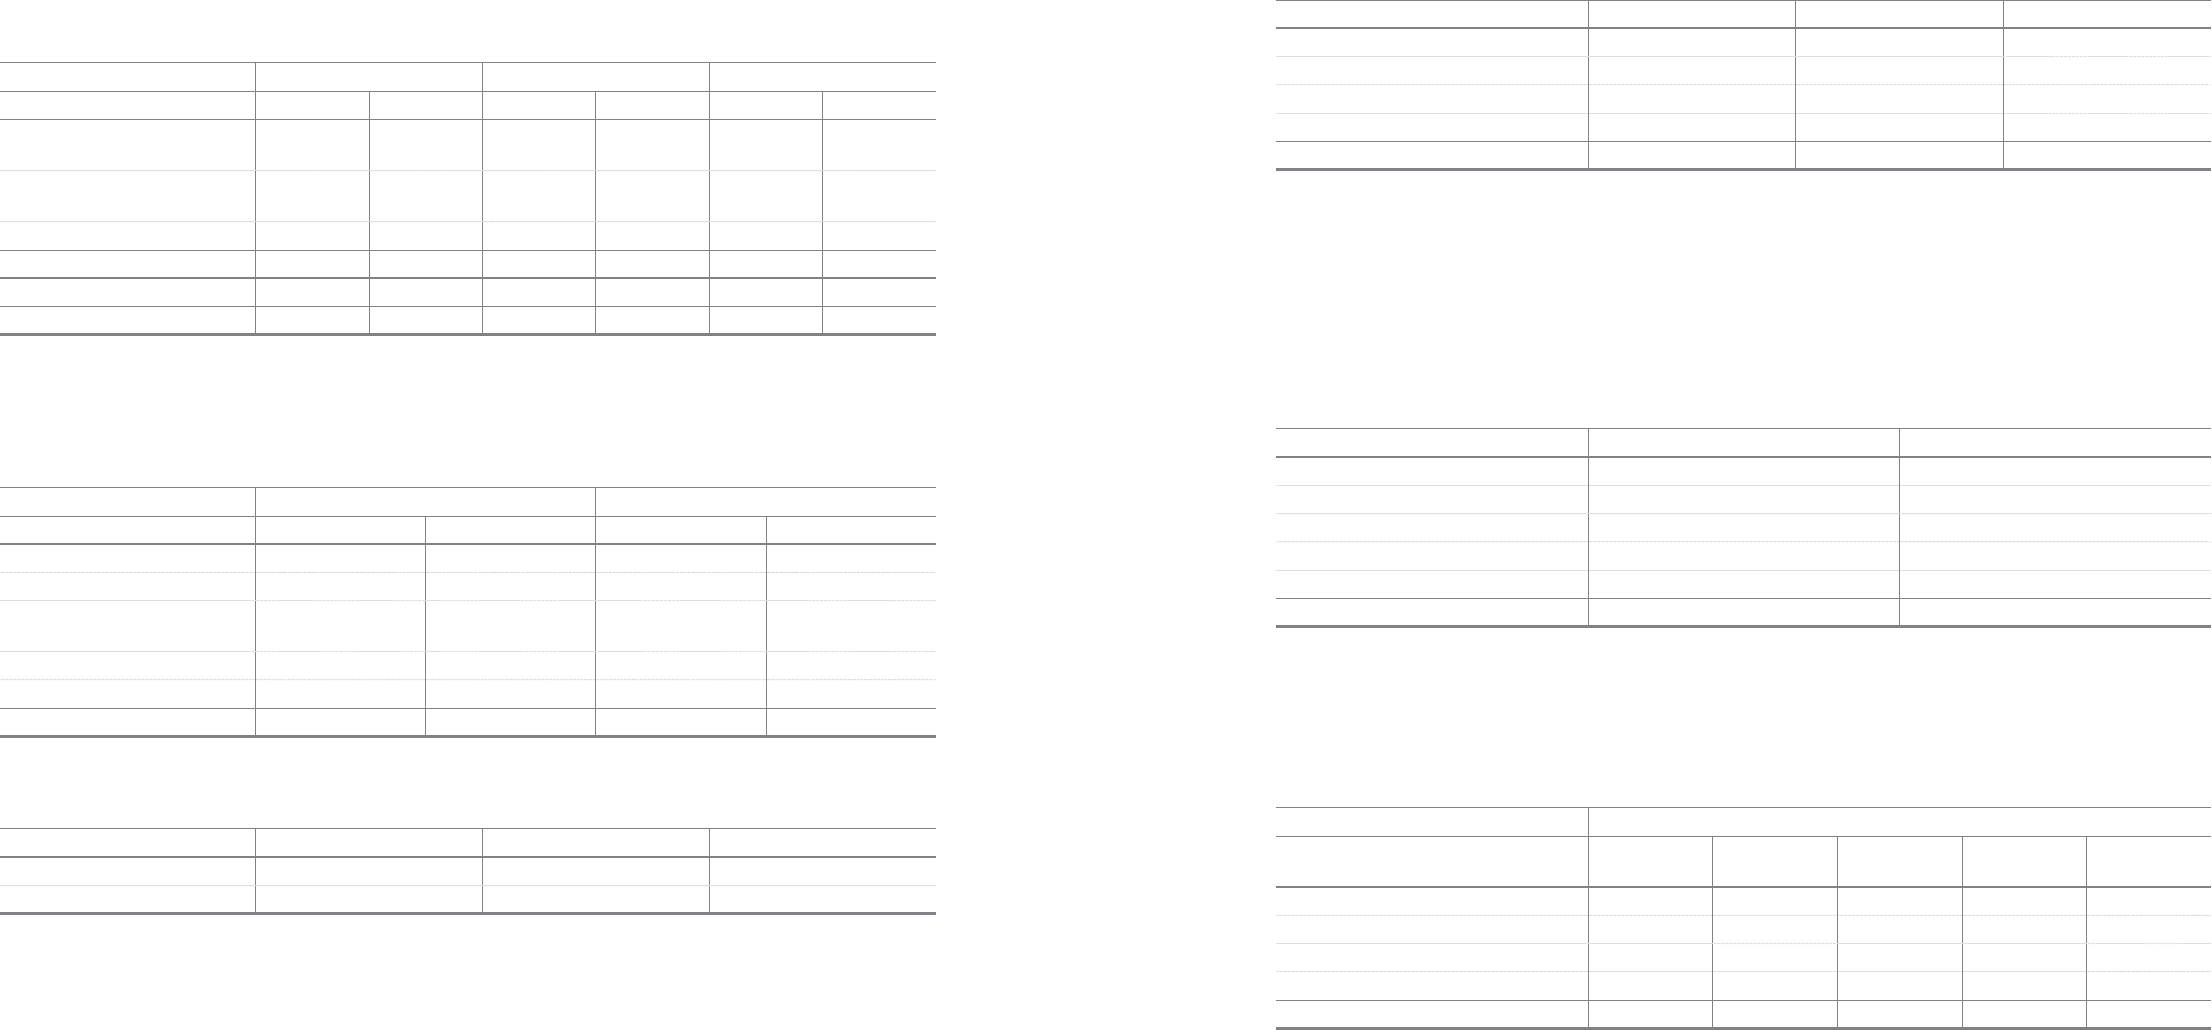
10. Associates and Joint Ventures
Associates and joint ventures as of December 31, 2010, consist of the following:
Financial information of associates and joint ventures as of and for the year ended December 31, 2010, 2009 and January 1, 2009, follows:
1) Associates
2010 2009 2009. 1. 1
Finished goods
₩
4,511,391
₩
3,010,502
₩
3,064,671
Work in process 2,619,713 1,901,363 1,948,698
Raw materials and supplies 4,159,842 3,188,373 3,136,361
Materials-in-transit 2,073,578 1,739,091 1,248,345
Total
₩
13,364,524
₩
9,839,329
₩
9,398,075
(In millions of Korean Won)
(In millions of Korean Won)
(In millions of Korean Won)
2010 2009
At January 1
₩
7,334,705
₩
5,912,930
Acquisition of associates and joint ventures 243 180,916
Disposal of associates and joint ventures (216,733) (44,832)
Share of profit12,267,091 1,713,299
Others² (1,050,016) (427,608)
At December 31
₩
8,335,290
₩
7,334,705
2010
Investee Percentage of
ownership (%) Assets Liabilities Sales Proportionate
net income
Samsung Card 35.3
₩
14,246,893
₩
8,057,223
₩
3,171,971
₩
1,199,091
Samsung Electro-Mechanics 22.8 6,972,461 3,169,622 7,180,831 666,716
Samsung SDI 19.7 7,933,567 1,702,446 5,124,275 385,112
Samsung SDS 21.3 3,653,483 1,013,265 4,329,994 327,635
Samsung LED 50.0 1,339,988 788,624 1,317,753 204,399
1 Share of profit / (loss) is after tax and minority interest in associates.
2
Others consist of dividends and effect of change in foreign exchange rates. For the year ended December 31, it also includes effect from combination of
Samsung SDS and Samsung Networks.
(In millions of Korean Won)
(In millions of Korean Won)