Samsung 2010 Annual Report Download - page 33
Download and view the complete annual report
Please find page 33 of the 2010 Samsung annual report below. You can navigate through the pages in the report by either clicking on the pages listed below, or by using the keyword search tool below to find specific information within the annual report.-
 1
1 -
2
-
3
-
4
-
5
-
6
-
7
-
8
-
9
-
10
-
11
-
12
-
13
-
14
-
15
-
16
-
17
-
18
-
19
-
20
-
21
-
22
-
 23
23 -
 24
24 -
 25
25 -
 26
26 -
 27
27 -
 28
28 -
 29
29 -
 30
30 -
 31
31 -
 32
32 -
 33
33 -
 34
34 -
 35
35 -
 36
36 -
 37
37 -
 38
38 -
 39
39 -
 40
40 -
 41
41 -
 42
42 -
 43
43 -
44
-
45
-
46
-
47
-
48
 |
 |
62 63
NOTES TO THE CONSOLIDATED FINANCIAL STATEMENTS
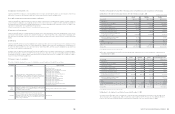
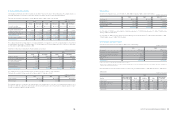
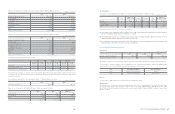
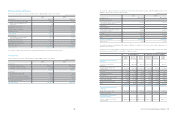
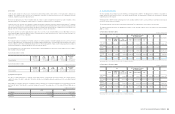
12. Intangible Assets
Changes in intangible assets for the years ended December 31, 2010 and 2009, are as follows:
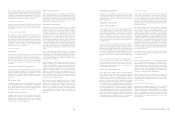
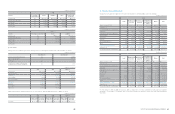
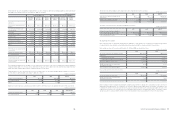
The amortization expense of intangible assets for the years ended December 31, 2010 and 2009, is allocated to the following accounts:
2009
Intellectual
property rights
Development
expense Membership Goodwill Others Total
Balance at January 1, 2009
₩
405,817
₩
200,478
₩
170,546
₩
9,885
₩
301,346
₩
1,088,072
Internally generated (Development costs) - 176,530 - - - 176,530
External acquisition 174,445 - 14,309 - 184,769 373,523
Business combinations - - - 80,300 (275) 80,025
Amortization (80,891) (157,149) (128,362) (366,402)
Disposal (38,011) (5,408) (1,232) - (12,144) (56,795)
Net exchange differences 5,669 - - (1,982) (190) 3,497
Others (13,481) - - (4,741) (24,220) (42,442)
Balance at December 31, 2009
₩
453,548
₩
214,451
₩
183,623
₩
83,462
₩
320,924
₩
1,256,008
(In millions of Korean Won)
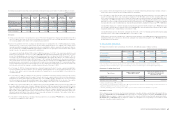
2010
Intellectual
property rights
Development
expense Membership Goodwill Others Total
Balance at January 1, 2010
₩
453,548
₩
214,451
₩
183,623
₩
83,462
₩
320,924
₩
1,256,008
Internally generated (Development costs) - 311,510 - - - 311,510
External acquisition 144,037 - 8,715 - 795,633 948,385
Business combinations (*) 119,805 - - 624,284 242,688 986,777
Amortization (76,182) (191,344) - - (278,996) (546,522)
Disposal (15,768) - (852) - - (16,620)
Impairment (**) (5,382) - - (154,117) (674) (160,173)
Net exchange differences (153) - 7 (281) (1,658) (2,085)
Others (18,023) - (62) 18,064 2,180 2,159
Balance at December 31, 2010
₩
601,882
₩
334,617
₩
191,431
₩
571,412
₩
1,080,097
₩
2,779,439
(*) The amount includes intangible assets and goodwill arising from the business combination with Samsung Digital Imaging.
(**) The impairment charge relates to Samsung Digital Imaging, and is a result of a decline in market profitability share and increased market competitiveness
that occurred in the fourth quarter of 2010.
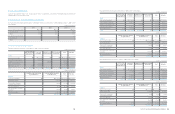
Account 2010 2009
Production costs
₩
236,223
₩
285,063
Selling general and administrative expenses 227,195 78,083
Research and development expenses 83,104 3,256
Total
₩
546,522
₩
366,402
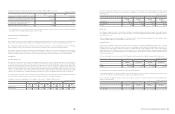
Goodwill was allocated to each cash-generating unit. The recoverable amounts of cash generating units have been determined based on
value-in-use calculations. The Company has performed impairment test for goodwill annually. The revenue growth rate and discount rate
associated with future cash flows were the major assumptions. The majority of good will as of December 31, 2010 relates to the business
combination with Samsung Digital Imaging. For this goodwill, the discount rate used to present value cash flows of the cash-generating unit
as of December 31, 2010 was 15.23%. The revenue growth rate was based on the Company’s forecast for the next five years, and its range
was 2.5%. The Company determines its revenue growth rate based on historical performance and its expectation for market conditions.
The applied weighted average growth rate is consistent with industry reports.
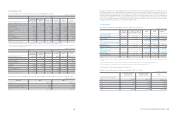
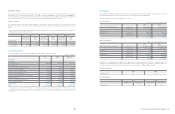
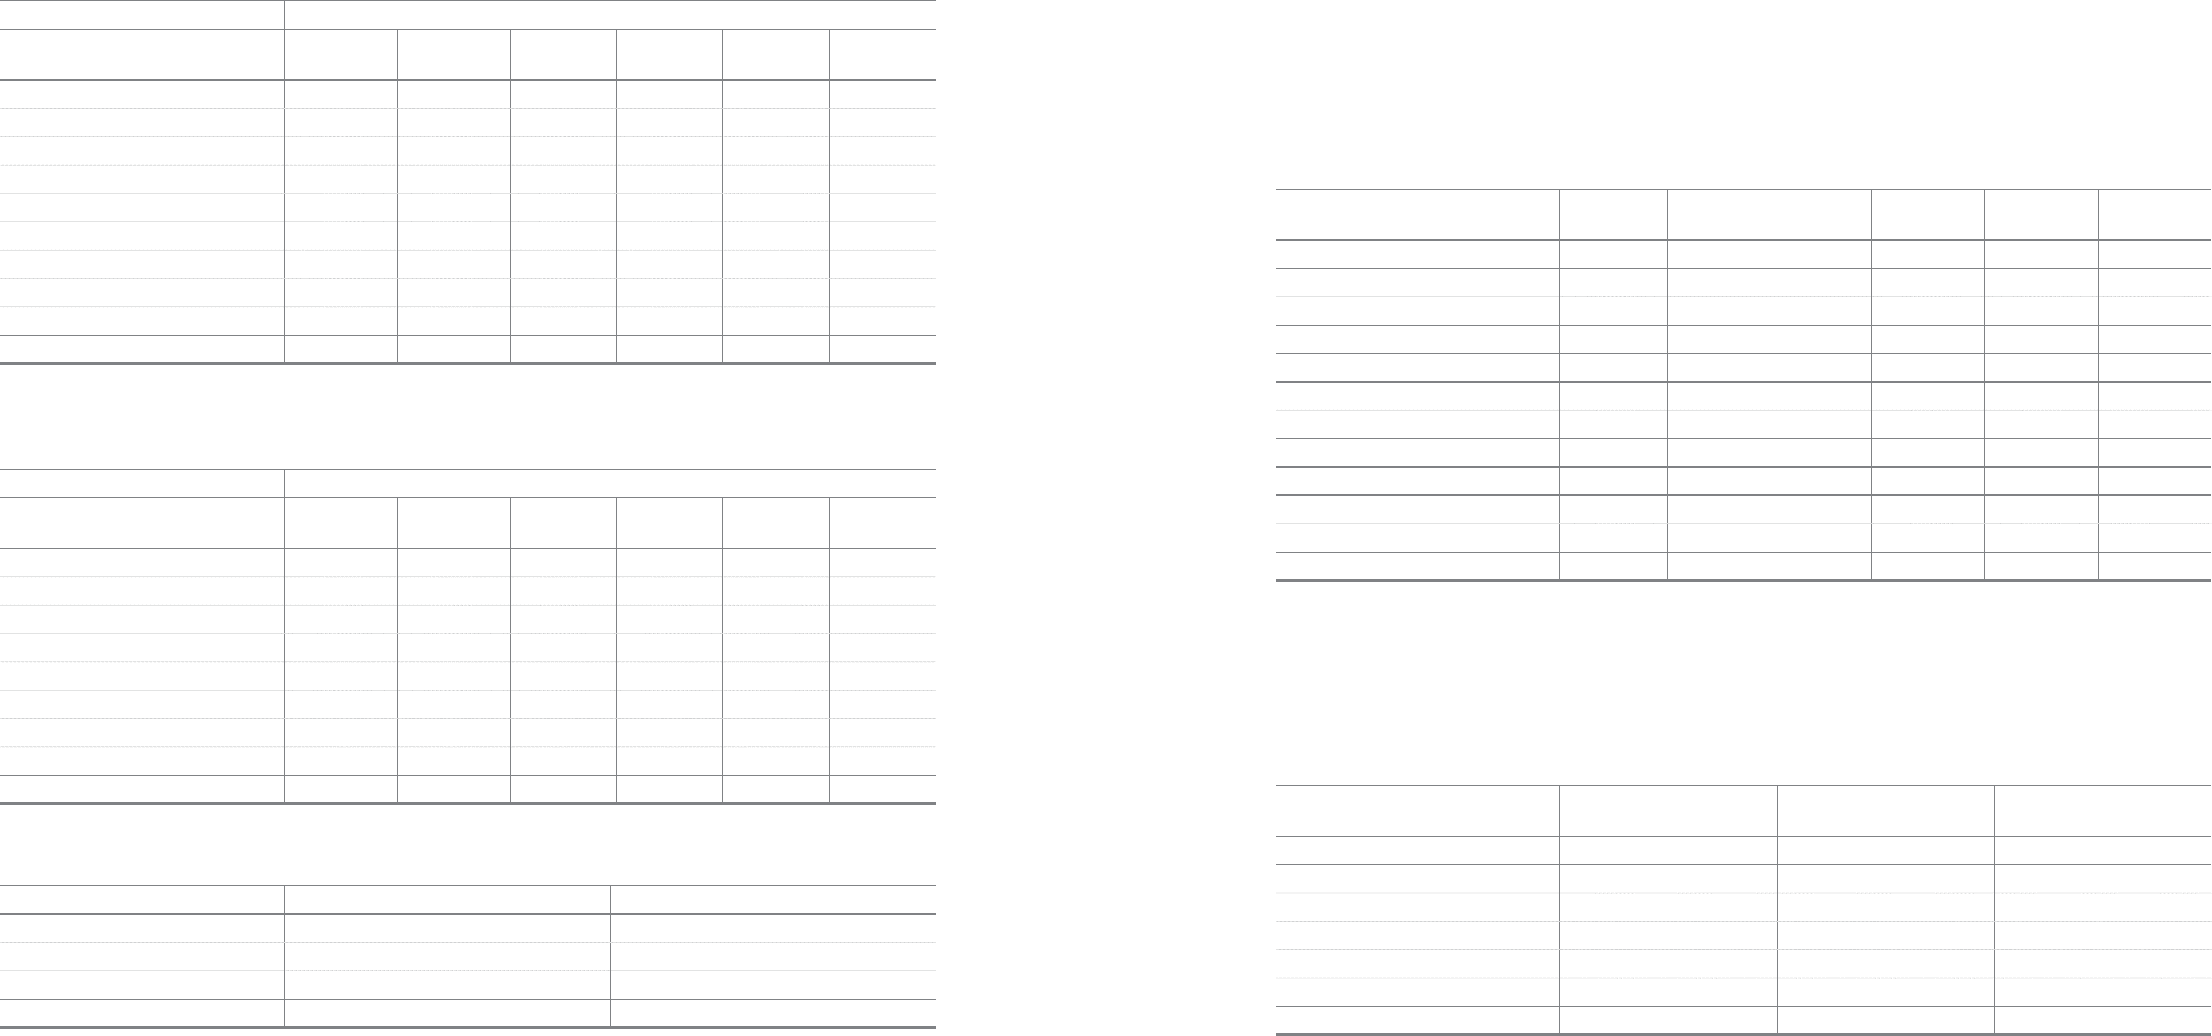
13. Borrowings
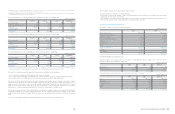
Borrowings as of December 31, 2010, 2009 and January 1, 2009, consist of the following:
The carrying value of the borrowings approximates their fair value.
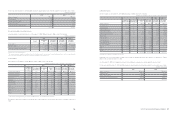
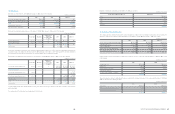
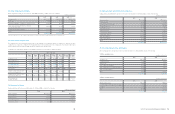
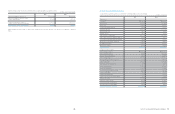
Maturities of long-term borrowings, outstanding as of December 31, 2010, are as follows:
Financial
institutions
Annual interest rates (%)
as of December 31, 2010 2010 2009 2009. 1. 1
Short-term borrowings
Collateralized borrowings Woori Bank etc 1.5 ~ 4.6
₩
5,090,433
₩
5,355,185
₩
5,533,419
Bank borrowings Woori Bank etc 0.2 ~ 16.4 3,339,288 2,424,822 3,521,124
Total
₩
8,429,721
₩
7,780,007
₩
9,054,543
Current portion of long-term borrowings
Bank borrowings Woori Bank etc 1.0 ~ 9.6
₩
1,008,884
₩
123,100
₩
13,094
Financial lease liabilities APCI etc 6.0 ~ 15.7 9,591 5,639 1,345
Total
₩
1,018,475
₩
128,739
₩
14,439
Long-term borrowings
Bank borrowings Woori Bank etc 1.0 ~ 9.6
₩
536,871
₩
1,047,937
₩
913,191
Financial lease liabilities APCI etc 2.3 ~ 15.7 97,510 108,157 56,648
Total
₩
634,381
₩
1,156,094
₩
969,839
(In millions of Korean Won)
(In millions of Korean Won)
(*1) As of December 31, 2010, 2009 and January 1, 2009, overdraft facilities of the Company amount to
202,700 million,
239,300 million and
239,300
million.
(*2) Collateralized borrowings are secured by trade receivables (Note 8). Bank borrowings are secured by lands and buildings (Note 11).
(*3) The Company leases certain property, plant and equipment under various finance lease arrangements (Note 17).
Long-term borrowings
in local currency
Long-term borrowings
in foreign currency Total
For the years ending December 31
2011
₩
254,850
₩
763,625
₩
1,018,475
2012 2,430 42,828 45,258
2013 50,000 465,696 515,696
2014 - 13,143 13,143
Thereafter - 60,284 60,284
Total
₩
307,280
₩
1,345,576
₩
1,652,856
(In millions of Korean Won)
(In millions of Korean Won)