Samsung 2010 Annual Report Download - page 38
Download and view the complete annual report
Please find page 38 of the 2010 Samsung annual report below. You can navigate through the pages in the report by either clicking on the pages listed below, or by using the keyword search tool below to find specific information within the annual report.-
 1
1 -
2
-
3
-
4
-
5
-
6
-
7
-
8
-
9
-
10
-
11
-
12
-
13
-
14
-
15
-
16
-
17
-
18
-
19
-
20
-
21
-
22
-
23
-
24
-
25
-
26
-
27
-
 28
28 -
 29
29 -
 30
30 -
 31
31 -
 32
32 -
 33
33 -
 34
34 -
 35
35 -
 36
36 -
 37
37 -
 38
38 -
 39
39 -
 40
40 -
 41
41 -
 42
42 -
 43
43 -
 44
44 -
 45
45 -
 46
46 -
 47
47 -
 48
48
 |
 |
72 73
NOTES TO THE CONSOLIDATED FINANCIAL STATEMENTS
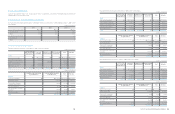
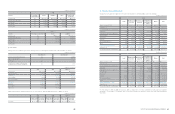
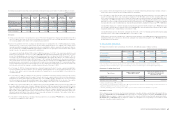
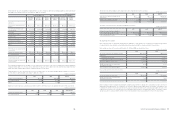
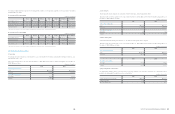
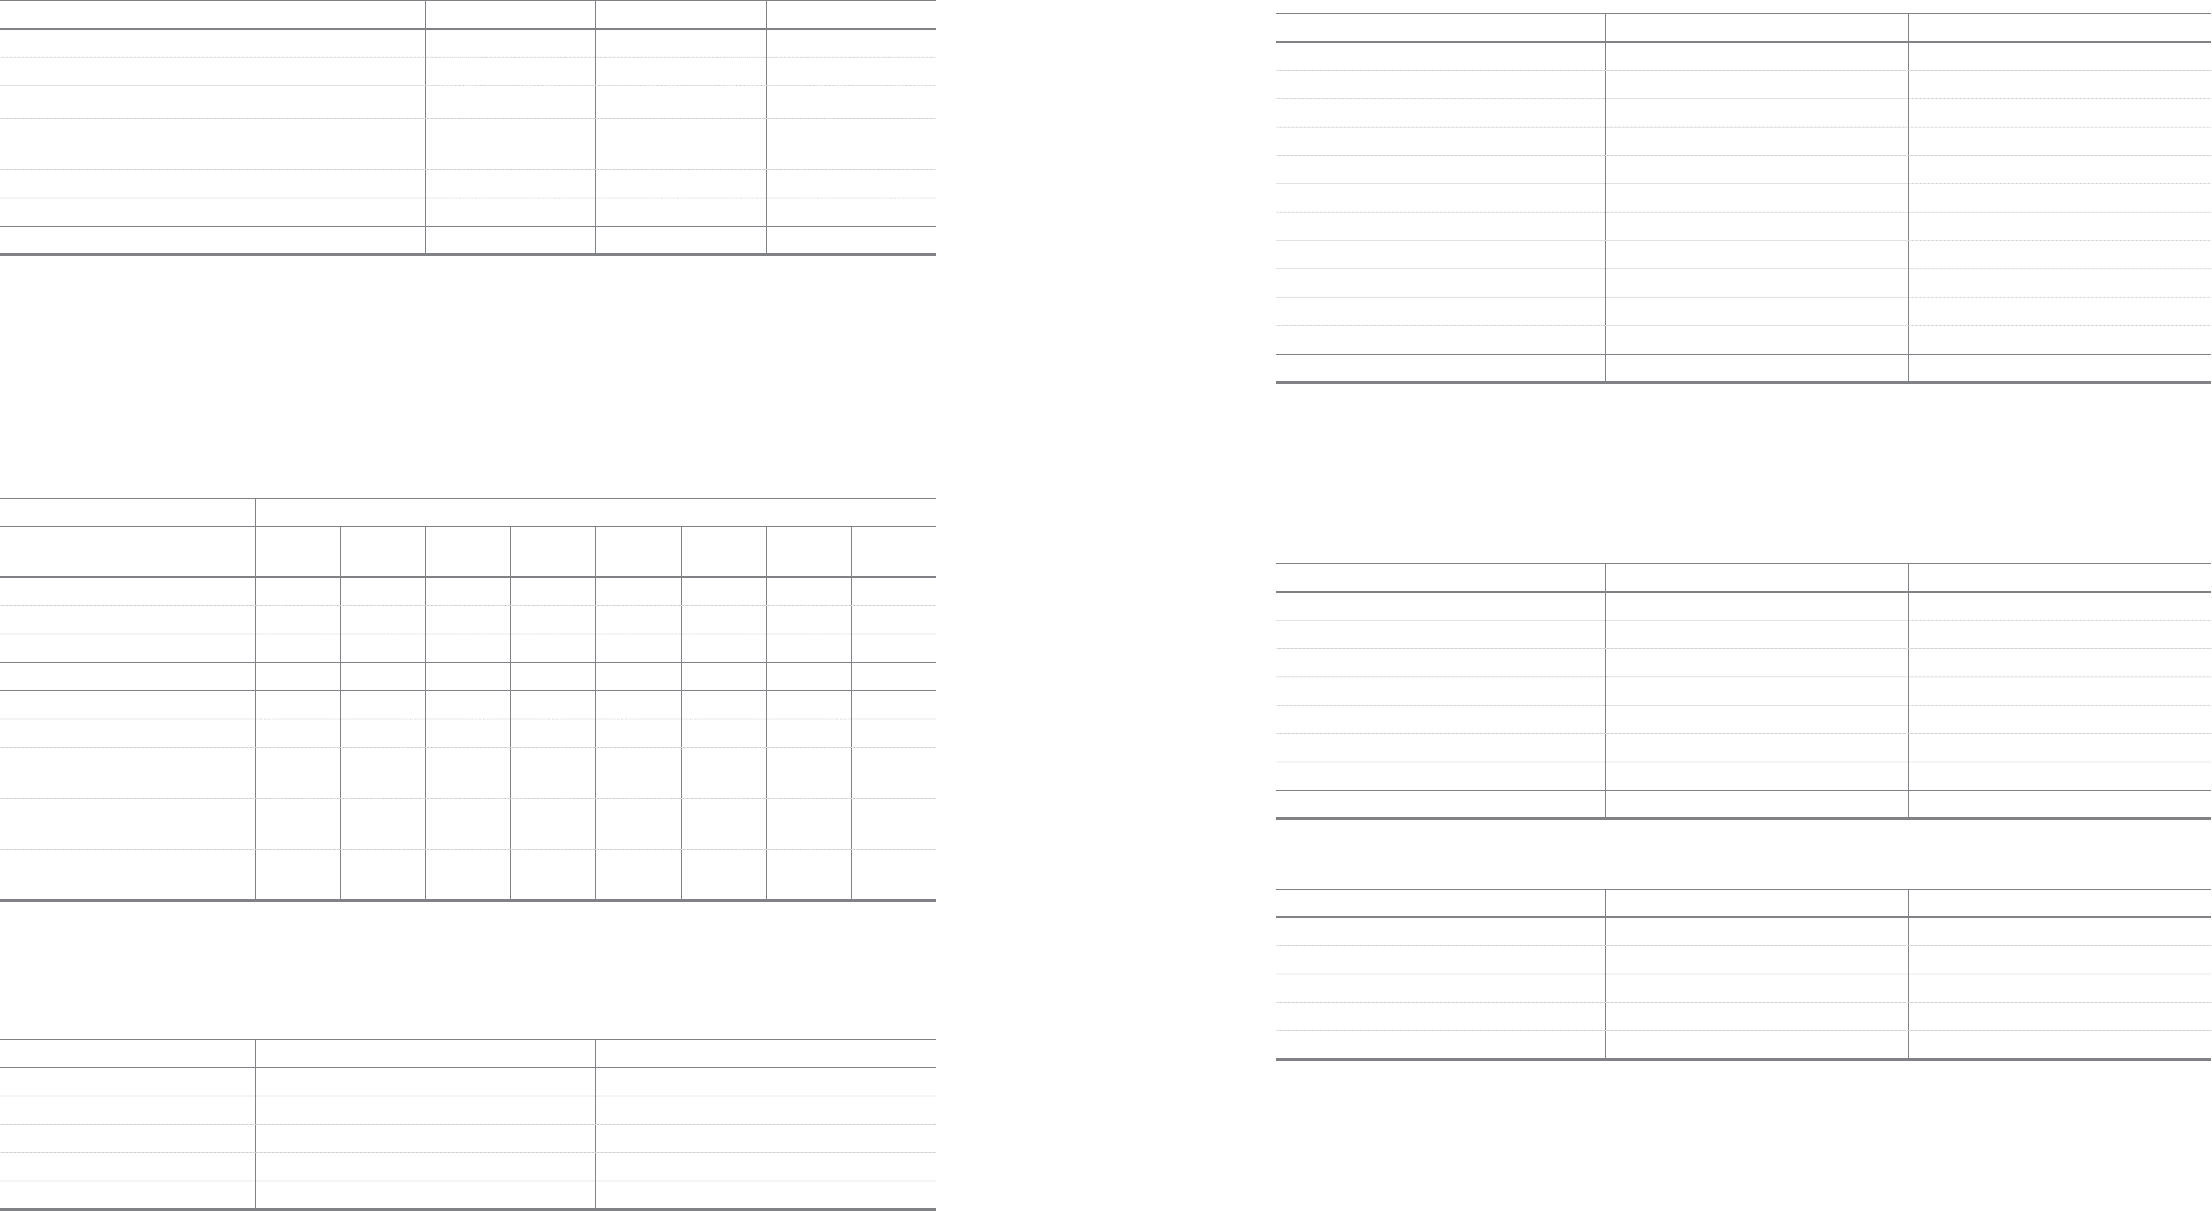
21. Other Components of Equity
Other components of equity as of December 31, 2010, 2009 and January 1, 2009, consist of the following:
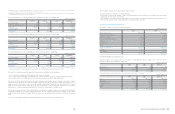
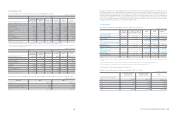
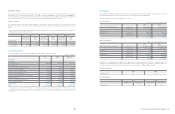
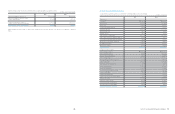
22. Share Based Compensation
The Company has a stock option plan that provides for the granting of stock purchase options to employees or directors who have
contributed or are expected to contribute to the management and technological innovation of the Company. No Share based compensation
has been granted since December 20, 2005. All options currently in issue are fully vested.
A summary of the terms and the number of outstanding stock options as of December 31, 2010 is as follows:
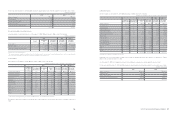
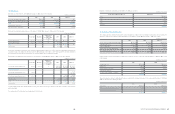
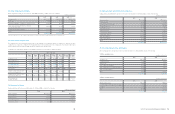
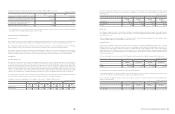
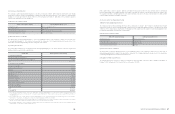
23. Expenses by Nature
Expenses by nature for the years ended December 31, 2010 and 2009, consists of the following:
2010 2009 2009. 1. 1
Treasury stock (*)
₩
(7,761,927)
₩
(8,404,791)
₩
(8,910,135)
Stock option 128,320 213,083 385,957
Unrealized holding gains on available-for-sale financial assets 1,608,035 681,608 575,400
Share of associates and joint ventures accumulated
other comprehensive gains 1,185,333 797,876 747,997
Foreign-currency translation differences (957,579) (745,777) -
Others 1,071,420 656,400 593,089
₩
(4,726,398)
₩
(6,801,601)
₩
(6,607,692)
(In millions of Korean Won)
(*) As of December 31, 2010, the Company holds 17,456,260 common shares and 2,979,693 preferred shares as treasury stocks.
Date of the grant
March
16, 2000
March
9, 2001
February
28, 2002
March
25, 2002
March
7, 2003
April
16, 2004
October
15, 2004
December
20, 2005
At January 1, 2009 521,715 925,815 425,757 56,890 165,442 524,871 - 10,000
Exercised during 2009 467,208 476,406 150,253 24,036 56,607 60,969 - -
At December 31, 2009 54,507 449,409 275,504 32,854 108,835 463,902 10,000
Exercised during 2010 54,507 273,337 115,283 1,879 33,960 119,334 - -
At December 31, 2010 - 176,072 160,221 30,975 74,875 344,568 - -
Exercise price
₩
272,700
₩
197,100
₩
329,200
₩
342,800
₩
288,800
₩
580,300
₩
460,500
₩
606,700
Weighted average share price at the
date of exercise during 2009 675,010 710,883 708,166 769,943 712,980 765,098 - -
Weighted average share price at the
date of exercise during 2010
₩
779,377
₩
853,456
₩
845,473
₩
840,201
₩
852,484
₩
863,578 - -
Exercise period from
the date of the grant 3-10years 3-10years 2-10years 2-10years 2-10years 2-10years 2-4years 2-10years
2010 2009
Wages and salaries
₩
11,380,257
₩
8,526,254
Pension expenses 563,408 533,411
Welfare expenses 1,618,992 1,184,154
Depreciation expenses 10,847,374 10,771,334
Amortization expenses 546,522 366,402
(In millions of Korean Won)
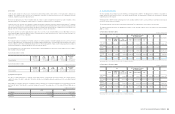
24. Selling, General and Administrative Expenses
Selling, general and administrative expenses for the years ended December 31, 2010 and 2009, consists of the following:
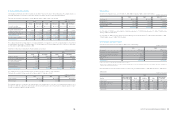
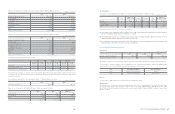
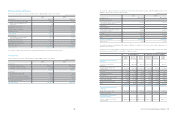
25. Other Operating Income and Expense
Other operating income and expenses for the years ended December 31, 2010 and 2009, consists of the following:
1) Other operating income
2) Other operating expense
2010 2009
Wages and salaries
₩
3,373,365
₩
2,618,223
Pension expenses 155,894 113,936
Commission and service charges 6,769,346 6,130,443
Depreciation expenses 351,085 321,447
Amortization expenses 227,195 78,083
Advertising expenses 3,282,798 2,702,874
Sales promotion expenses 3,271,993 3,416,652
Transportation expenses 4,108,830 3,333,470
After service expenses 2,454,601 2,441,778
Public relation expenses 494,599 471,026
Others 1,753,416 1,734,154
₩
26,243,122
₩
23,362,086
2010 2009
Dividend income
₩
32,829
₩
28,120
Commission income 21,652 80,580
Rental income 96,562 92,853
Gain on disposal of investments 412,715 45,015
Gain on disposal of property, plant and equipment 282,941 54,524
Gain on transfer of business 179,418 -
Other 729,324 536,442
₩
1,755,441
₩
837,534
2010 2009
Other bad debts expense
₩
15,254
₩
6,821
Loss from disposal of property, plant and equipment 276,080 120,133
Donations 218,863 110,783
Other 569,738 654,547
₩
1,079,935
₩
892,284
(In millions of Korean Won)
(In millions of Korean Won)
(In millions of Korean Won)