Samsung 2010 Annual Report Download - page 32
Download and view the complete annual report
Please find page 32 of the 2010 Samsung annual report below. You can navigate through the pages in the report by either clicking on the pages listed below, or by using the keyword search tool below to find specific information within the annual report.-
 1
1 -
2
-
3
-
4
-
5
-
6
-
7
-
8
-
9
-
10
-
11
-
12
-
13
-
14
-
15
-
16
-
17
-
18
-
19
-
20
-
21
-
 22
22 -
 23
23 -
 24
24 -
 25
25 -
 26
26 -
 27
27 -
 28
28 -
 29
29 -
 30
30 -
 31
31 -
 32
32 -
 33
33 -
 34
34 -
 35
35 -
 36
36 -
 37
37 -
 38
38 -
 39
39 -
 40
40 -
 41
41 -
 42
42 -
43
-
44
-
45
-
46
-
47
-
48
 |
 |
60 61
NOTES TO THE CONSOLIDATED FINANCIAL STATEMENTS
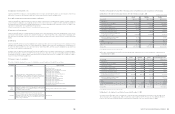
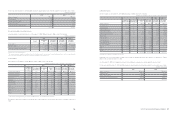
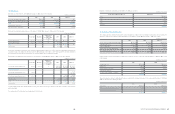
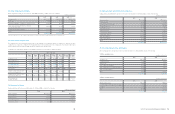
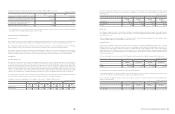
2) Joint ventures
A listing of interests in significant joint ventures and the proportion of ownership interest held in jointly controlled entities is as follows:
Market value information of publicly listed investees as of December 31, 2010 and 2009, and January 1, 2009 are as follows:
(In millions of Korean Won)
(In millions of Korean Won)
(In millions of Korean Won)
2009
Investee Percentage of
ownership (%) Assets Liabilities Sales Proportionate
net income
Samsung Card 35.3
₩
13,462,265
₩
8,957,605
₩
2,716,224
₩
612,030
Samsung Electro-Mechanics 22.8 4,198,925 1,600,520 3,192,031 310,946
Samsung SDI 19.7 6,388,498 1,535,513 3,550,584 232,050
Samsung SDS 21.3 1,992,836 598,347 2,494,052 272,450
Samsung LED 50.0 751,053 404,603 544,598 59,114
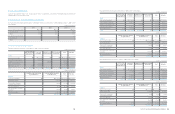
2009. 1. 1
Investee Percentage of ownership (%) Assets Liabilities
Samsung Card 35.3
₩
16,822,733
₩
12,996,775
Samsung Electro-Mechanics 22.8 3,208,324 1,258,004
Samsung SDI 19.7 5,863,583 1,414,290
Samsung SDS 21.3 1,872,801 730,698
Samsung LED - - -
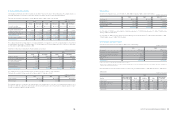
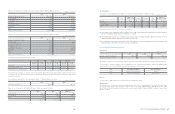
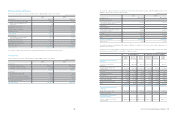
(In millions of Korean Won)
Ownership (%) Invest amount
Samsung Corning Precision Materials 42.5 297,165
Siltronic Samsung Wafers 50.0 266,949
TSST Japan 49.0 150,451
Syrian Korean Company for Manufacturing
& Marketing Telecommunication Equipment 49.0 2,061
2010 2009 2009. 1. 1
Current assets
₩
1,772,685
₩
2,213,686
₩
1,365,509
Non-current assets 2,028,554 1,753,952 1,934,880
Total assets 3,801,239 3,967,638 3,300,389
Current liabilities 581,971 657,148 625,228
Non-current liabilities 363,499 331,819 311,590
Net assets 2,855,769 2,978,671 2,363,571
Total sales 3,568,044 3,736,217 -
Total expense 2,134,170 2,572,603 -
Net income 1,433,874 1,163,614 -
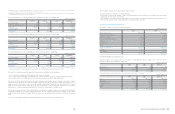
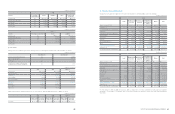
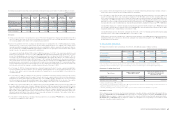
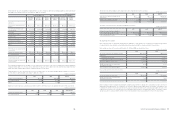
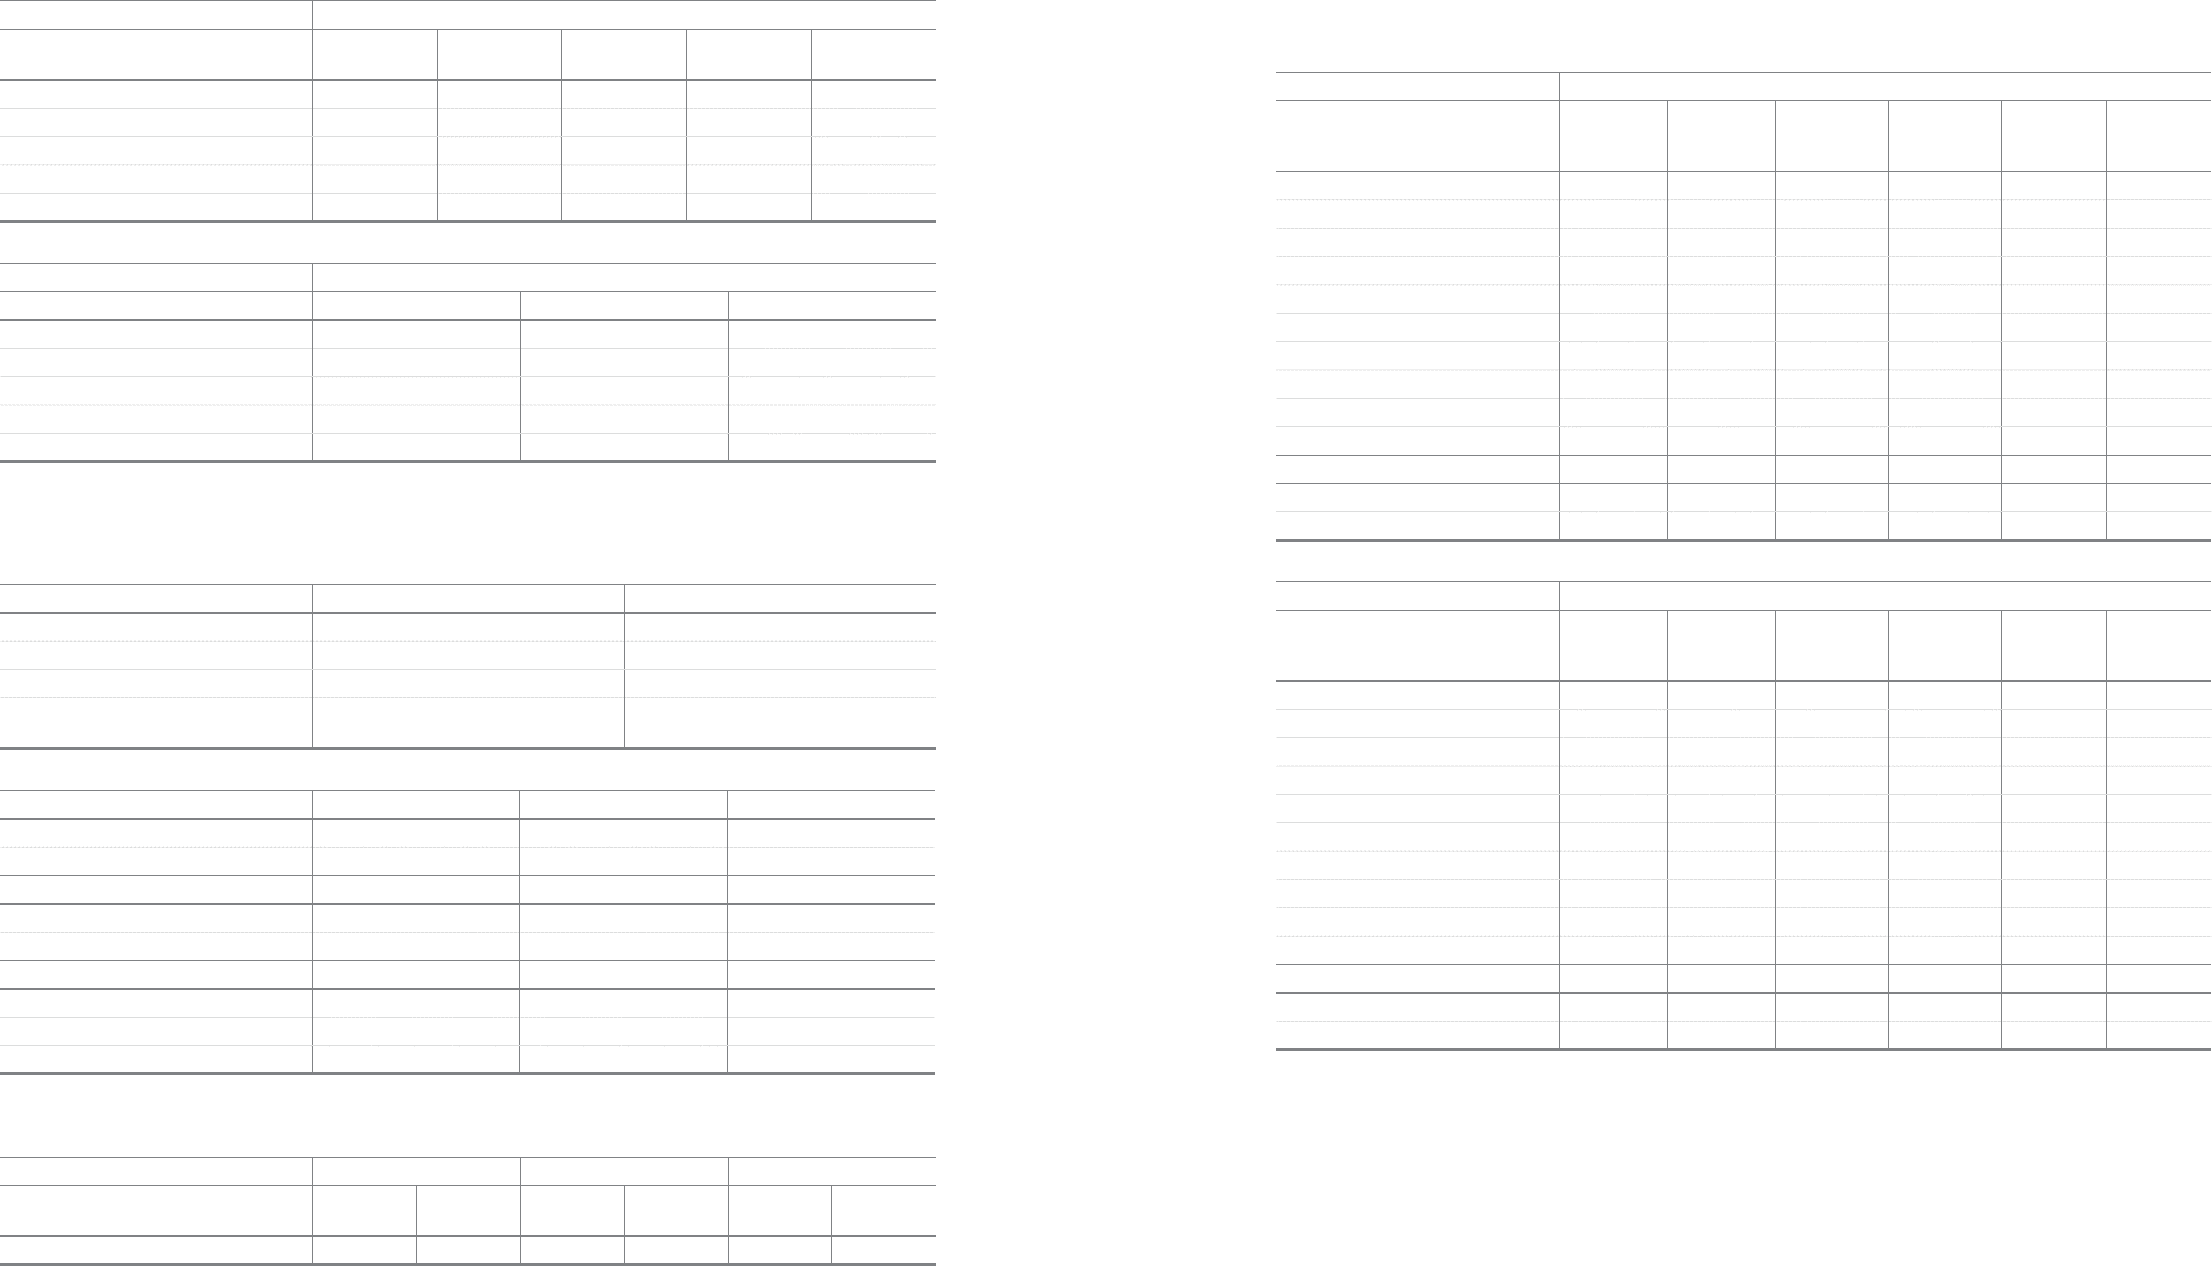
11. Property, Plant and Equipment
Changes in property, plant and equipment for the years ended December 31, 2010 and 2009, consist of the following:
As of December 31, 2010 and 2009 and January 1, 2009, a certain portion of overseas subsidiaries’ property, plant and equipment
amounting to
5,592 million,
5,518 million and
5,766 million is pledged as collateral for various loans from financial institutions,
respectively.
2010
Land Buildings and
structures
Machinery and
equipment
Construction-
in-progress /
machinery-in-
transit
Others Total
Balance at January 1, 2010
₩
7,017,731
₩
9,853,909
₩
22,288,401
₩
3,416,199
₩
984,055
₩
43,560,295
Acquisition cost 7,017,731 13,936,341 71,886,218 3,416,199 3,596,180 99,852,669
Accumulated depreciation and impairment - (4,082,432) (49,597,817) - (2,612,125) (56,292,374)
Acquisitions 8,250 369,090 1,619,721 19,167,984 454,199 21,619,244
Acquisitions from business combinations - 1,060 18,699 - 3,642 23,401
Reclassifications 114 1,111,636 12,950,627 (14,351,744) 289,367 -
Depreciation - (779,389) (9,679,264) - (388,721) (10,847,374)
Disposals (401,690) (168,543) (658,086) 1,890 (57,636) (1,284,065)
Net exchange differences 7,093 (35,136) (47,356) (23,051) 8,124 (90,326)
Others (106) (40,311) (18,169) 32,549 9,456 (16,581)
Balance at December 31, 2010
₩
6,631,392
₩
10,312,316
₩
26,474,573
₩
8,243,827
₩
1,302,486
₩
52,964,594
Acquisition cost 6,631,392 15,055,715 81,456,534 8,243,827 4,147,859 115,535,327
Accumulated depreciation and impairment - (4,743,399) (54,981,961) - (2,845,373) (62,570,733)
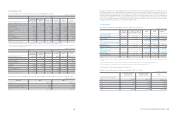
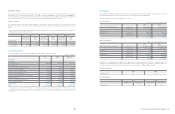
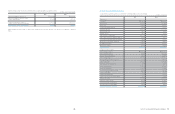
2009
Land Buildings and
structures
Machinery and
equipment
Construction-
in-progress /
machinery-in-
transit
Others Total
Balance at January 1, 2009
₩
6,901,822
₩
9,020,278
₩
24,023,386
₩
5,160,084
₩
1,171,187
₩
46,276,757
Acquisition cost 6,901,822 12,492,802 67,191,220 5,160,084 3,673,681 95,419,609
Accumulated depreciation and impairment - (3,472,524) (43,167,834) - (2,502,494) (49,142,852)
Acquisitions 14,972 49,720 89,661 7,545,684 372,128 8,072,165
Acquisitions from business combinations - 112,328 431,153 268,049 29,898 841,428
Reclassifications 132,952 1,456,309 7,131,260 (8,850,888) 130,367 -
Depreciation - (748,100) (9,390,162) - (633,072) (10,771,334)
Disposals (19,053) (42,301) (64,962) (28,872) (11,320) (166,508)
Net exchange differences (13,007) (106,651) (189,199) (184,365) (61,631) (554,853)
Others 45 112,326 257,264 (493,493) (13,502) (137,360)
Balance at December 31, 2009
₩
7,017,731
₩
9,853,909
₩
22,288,401
₩
3,416,199
₩
984,055
₩
43,560,295
Acquisition cost 7,017,731 13,936,341 71,886,218 3,416,199 3,596,180 99,852,669
Accumulated depreciation and impairment - (4,082,432) (49,597,817) - (2,612,125) (56,292,374)
(In millions of Korean Won)
(In millions of Korean Won)
2010 2009 2009. 1. 1
Market value
of investee
Recorded
book value
Market value
of investee
Recorded
book value
Market value
of investee
Recorded
book value
Associates
₩
5,153,483
₩
2,235,422
₩
4,776,448
₩
1,862,664
₩
1,658,452
₩
1,575,510
(In millions of Korean Won)