Samsung 2010 Annual Report Download - page 29
Download and view the complete annual report
Please find page 29 of the 2010 Samsung annual report below. You can navigate through the pages in the report by either clicking on the pages listed below, or by using the keyword search tool below to find specific information within the annual report.-
 1
1 -
2
-
3
-
4
-
5
-
6
-
7
-
8
-
9
-
10
-
11
-
12
-
13
-
14
-
15
-
16
-
17
-
18
-
 19
19 -
 20
20 -
 21
21 -
 22
22 -
 23
23 -
 24
24 -
 25
25 -
 26
26 -
 27
27 -
 28
28 -
 29
29 -
 30
30 -
 31
31 -
 32
32 -
 33
33 -
 34
34 -
 35
35 -
 36
36 -
 37
37 -
 38
38 -
 39
39 -
40
-
41
-
42
-
43
-
44
-
45
-
46
-
47
-
48
 |
 |
54 55
NOTES TO THE CONSOLIDATED FINANCIAL STATEMENTS
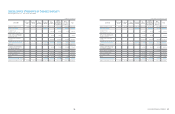
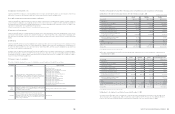
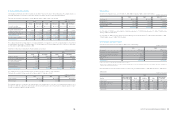
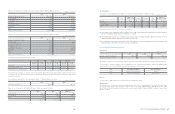
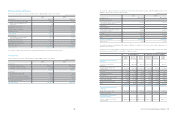
The following table presents the assets and liabilities that are measured at fair value at 31 December 2010.
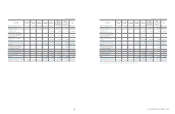
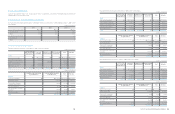
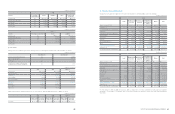
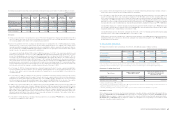
The following table presents the assets and liabilities that are measured at fair value at 31 December 2009.
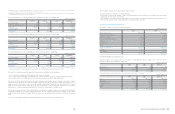
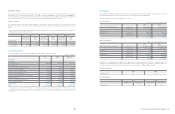
The following table presents the assets and liabilities that are measured at fair value at 1 January 2009.
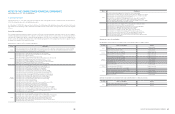
The levels of the fair value hierarchy and its application to financial assets and liabilities are described below
ㆍ
Level 1 : Quoted prices (unadjusted) in active markets for identical assets or liabilities
ㆍ
Level 2 : Inputs other than quoted prices included within level 1 that are observable for the asset or liability, either directly or indirectly
ㆍ
Level 3 : Inputs for the asset or liability that are not based on observable market data (that is, unobservable inputs)
The fair value of financial instruments traded in active markets is based on quoted market prices at the balance sheet date. A market is
regarded as active if quoted prices are readily and regularly available from an exchange, dealer, broker, industry group, pricing service, or
regulatory agency, and those prices represent actual and regularly occurring market transactions on an arm’s length basis. The quoted
market price used for financial assets held by the group is the current bid price. These instruments are included in level 1. Instruments
included in level 1 comprise primarily listed equity investments classified as trading securities or available-for-sale.
The fair value of financial instruments that are not traded in an active market (for example, over-the-counter derivatives) is determined by
using valuation techniques. These valuation techniques maximise the use of observable market data where it is available and rely as little as
possible on entity specific estimates. If all significant inputs required to fair value an instrument are observable, the instrument is included in
level 2.
If one or more of the significant inputs is not based on observable market data, the instrument is included in level 3.
Level 1 Level 2 Level 3 Total balance
Short-term derivatives
₩
-
₩
59,105
₩
-
₩
59,105
Available-for-sale financial assets (*) 2,051,371 1,770 197,861 2,251,002
Total assets 2,051,371 60,875 197,861 2,310,107
Short-term derivatives - 63,119 - 63,119
Total liabilities
₩
-
₩
63,119
₩
-
₩
63,119
(*) Other financial assets consist of amounts included in other current assets, deposits, and other non-current assets in the statement of financial position,
and do not include investments in joint-ventures and associated companies.
(**) Other financial liabilities consist of amounts included in accrued expenses, long term trade and other payables, other current and non-current liabilities
and withholdings, excluding items which are non-financial.
(*) Investments in Samsung Life Insurance and iMarket Korea, classified as available-for-sale financial assets, were listed during 2010,
₩
94,102 million of
level 3 as of December 31, 2009 and January 1, 2009 was transferred to level 1 (
₩
238,238 million as of December 31, 2010).
Level 1 Level 2 Level 3 Total balance
Short-term derivatives
₩
-
₩
34,458
₩
-
₩
34,458
Available-for-sale financial assets (*) 3,823,234 49,765 326,359 4,199,358
Total assets 3,823,234 84,223 326,359 4,233,816
Short-term derivatives - 24,638 - 24,638
Total liabilities
₩
-
₩
24,638
₩
-
₩
24,638
(In millions of Korean Won)
(In millions of Korean Won)
(In millions of Korean Won)
Level 1 Level 2 Level 3 Total balance
Short-term derivatives
₩
-
₩
16,242
₩
-
₩
16,242
Available-for-sale financial assets (*) 3,334,089 30,496 228,973 3,593,558
Total assets 3,334,089 46,738 228,973 3,609,800
Short-term derivatives - 15,122 - 15,122
Total liabilities
₩
-
₩
15,122
₩
-
₩
15,122
Specific valuation techniques used to value financial instruments include:
ㆍ
Quoted market prices or dealer quotes for similar instruments.
ㆍ
The fair value of forward foreign exchange contracts is determined using forward exchange rates at the balance sheet date, with the
resulting value discounted back to present value.
ㆍ
Other techniques, such as discounted cash flow analysis, are used to determine fair value for the remaining financial instruments. As for
trade and other receivables, the book value approximates a reasonable estimate of fair value.
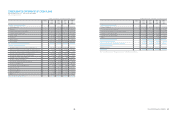
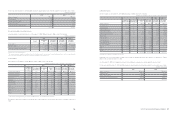
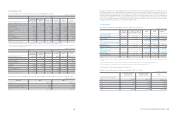
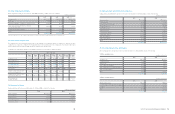
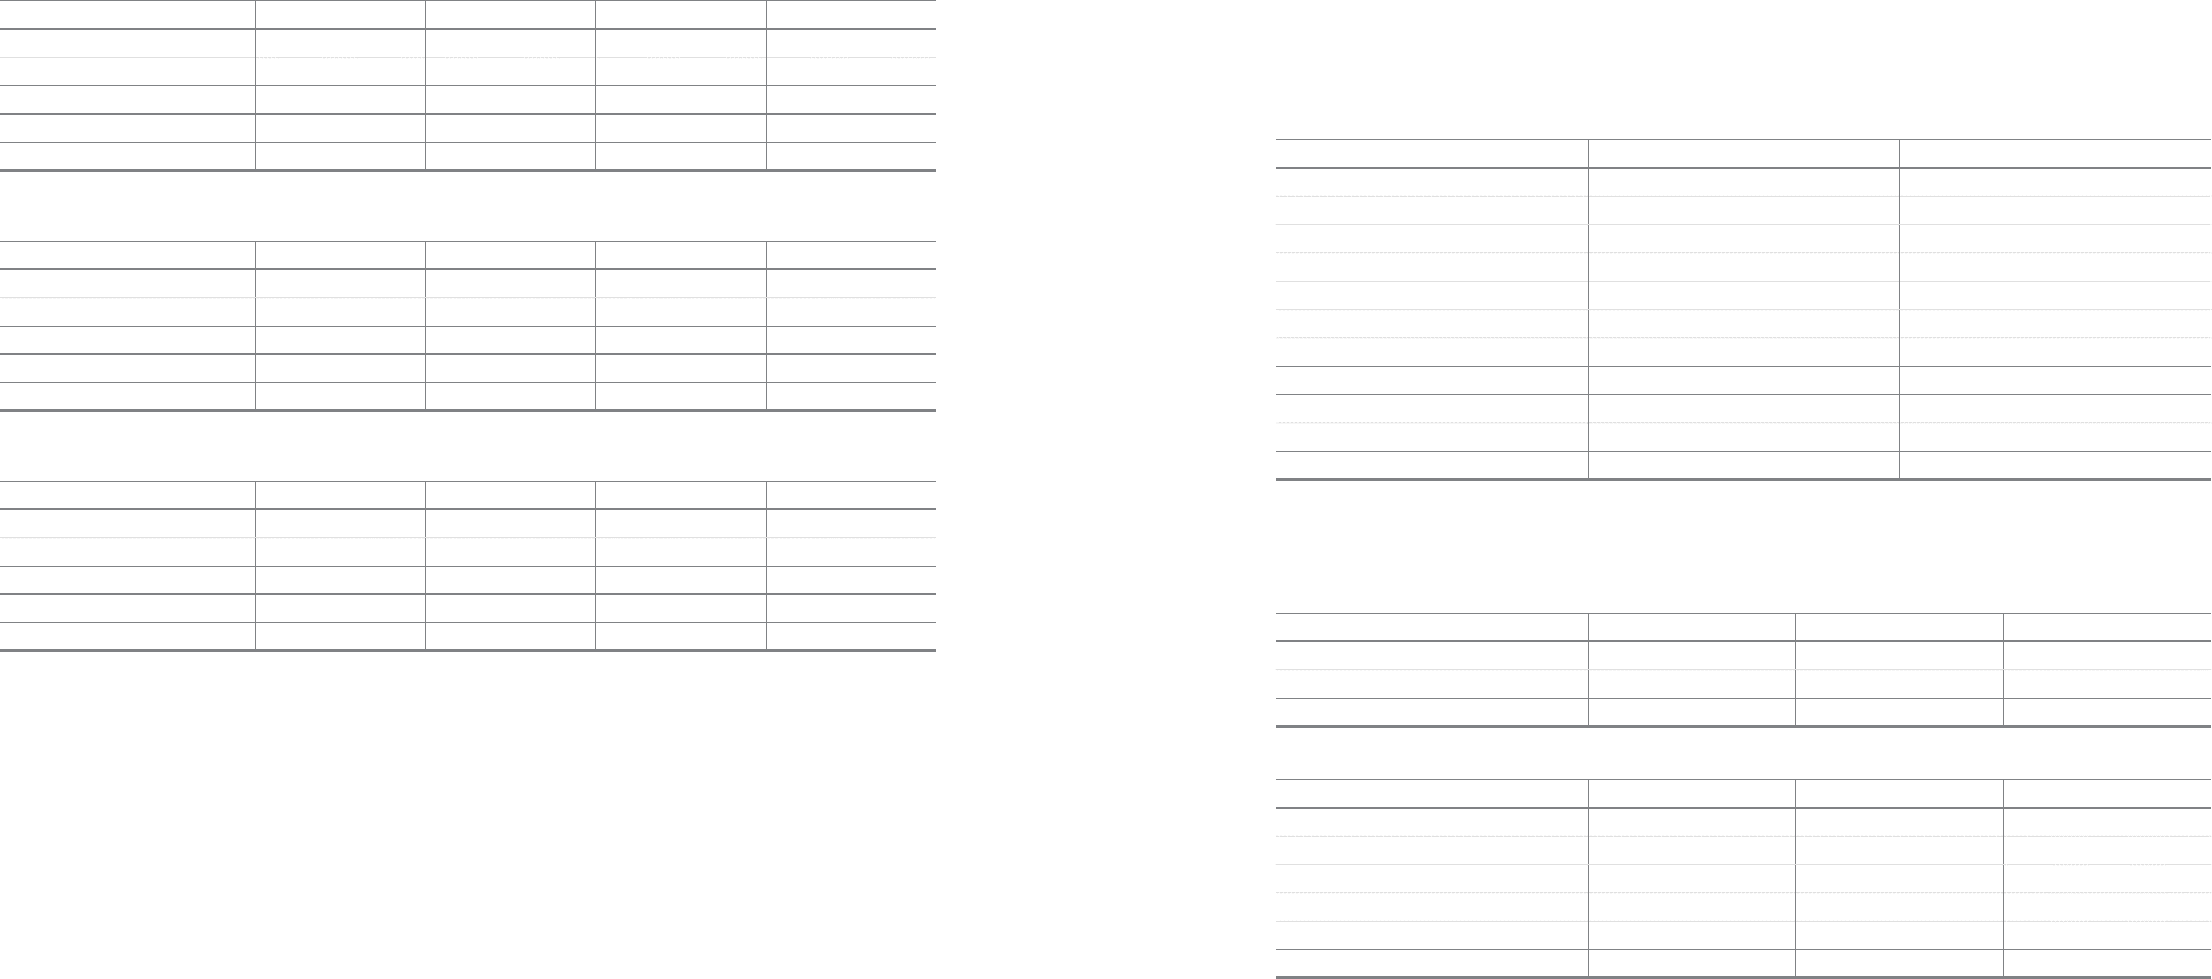
7. Available-for-sale Financial Assets
The changes of available-for-sale financial assets are as follows:
(1) Short-term available-for-sale financial assets
Short-term available-for-sale financial assets as of December 31, 2010, 2009 and January 1, 2009, consist of national bonds and
beneficiary certificates whose maturities are within 1 year.
2010 2009
Balance as of January 1
₩
3,593,558
₩
2,251,002
Translation & exchange difference 447 (2,567)
Acquisitions / additions 3,815,003 3,863,353
Dispositon / redemptions / reductions (4,378,927) (2,661,867)
Valuation (Losses) 1,193,297 143,637
Impairment loss (10,719) -
Others (13,301) -
Balance as of December 31
₩
4,199,358
₩
3,593,558
(1) Current 1,159,152 2,104,420
(2) Non-current 3,040,206 1,489,138
₩
4,199,358
₩
3,593,558
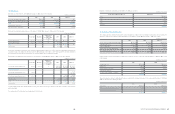
2010 2009 2009. 1. 1
National bonds
₩
8
₩
-
₩
-
Beneficiary certificates11,159,144 2,104,420 982,067
₩
1,159,152
₩
2,104,420
₩
982,067
2010 2009 2009. 1. 1
Bonds
₩
995,400
₩
1,569,532
₩
622,911
Time deposits 100,572 390,738 127,307
Certificates of deposit 39,708 118,689 231,561
Call loan 9,606 8,670 157
Others 13,858 16,791 131
₩
1,159,144
₩
2,104,420
₩
982,067
(In millions of Korean Won)
(In millions of Korean Won)
(In millions of Korean Won)
1 Beneficiary certificates as of December 31, 2010, 2009 and January 1, 2009, consist of the following