Samsung 2010 Annual Report Download - page 41
Download and view the complete annual report
Please find page 41 of the 2010 Samsung annual report below. You can navigate through the pages in the report by either clicking on the pages listed below, or by using the keyword search tool below to find specific information within the annual report.-
 1
1 -
2
-
3
-
4
-
5
-
6
-
7
-
8
-
9
-
10
-
11
-
12
-
13
-
14
-
15
-
16
-
17
-
18
-
19
-
20
-
21
-
22
-
23
-
24
-
25
-
26
-
27
-
28
-
29
-
30
-
 31
31 -
 32
32 -
 33
33 -
 34
34 -
 35
35 -
 36
36 -
 37
37 -
 38
38 -
 39
39 -
 40
40 -
 41
41 -
 42
42 -
 43
43 -
 44
44 -
 45
45 -
 46
46 -
 47
47 -
 48
48
 |
 |
78 79
NOTES TO THE CONSOLIDATED FINANCIAL STATEMENTS
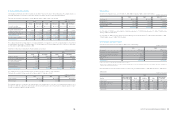
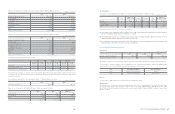
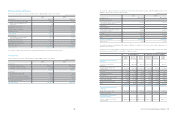
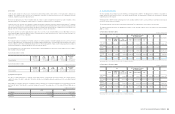
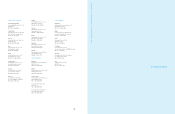
Diluted earnings per share for the years ended December 31, 2010 and 2009, is calculated as follows:
Diluted earnings per preferred share is equal to basic earnings per preferred share because stock options are not applicable to preferred
shares.
2010 2009
Net income available for common stock
₩
13,702,618
₩
8,287,748
Net income available for common stock and
common equivalent shares 13,702,618 8,287,748
Weighted-average number of shares of
common stock and common shares equivalent 129,671,320 128,321,122
Diluted earnings per share (In Korean Won)
₩
105,672
₩
64,586
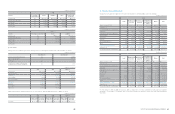
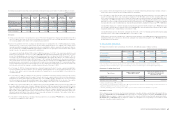
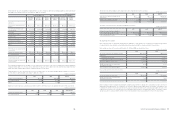
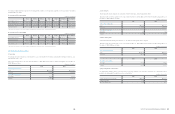
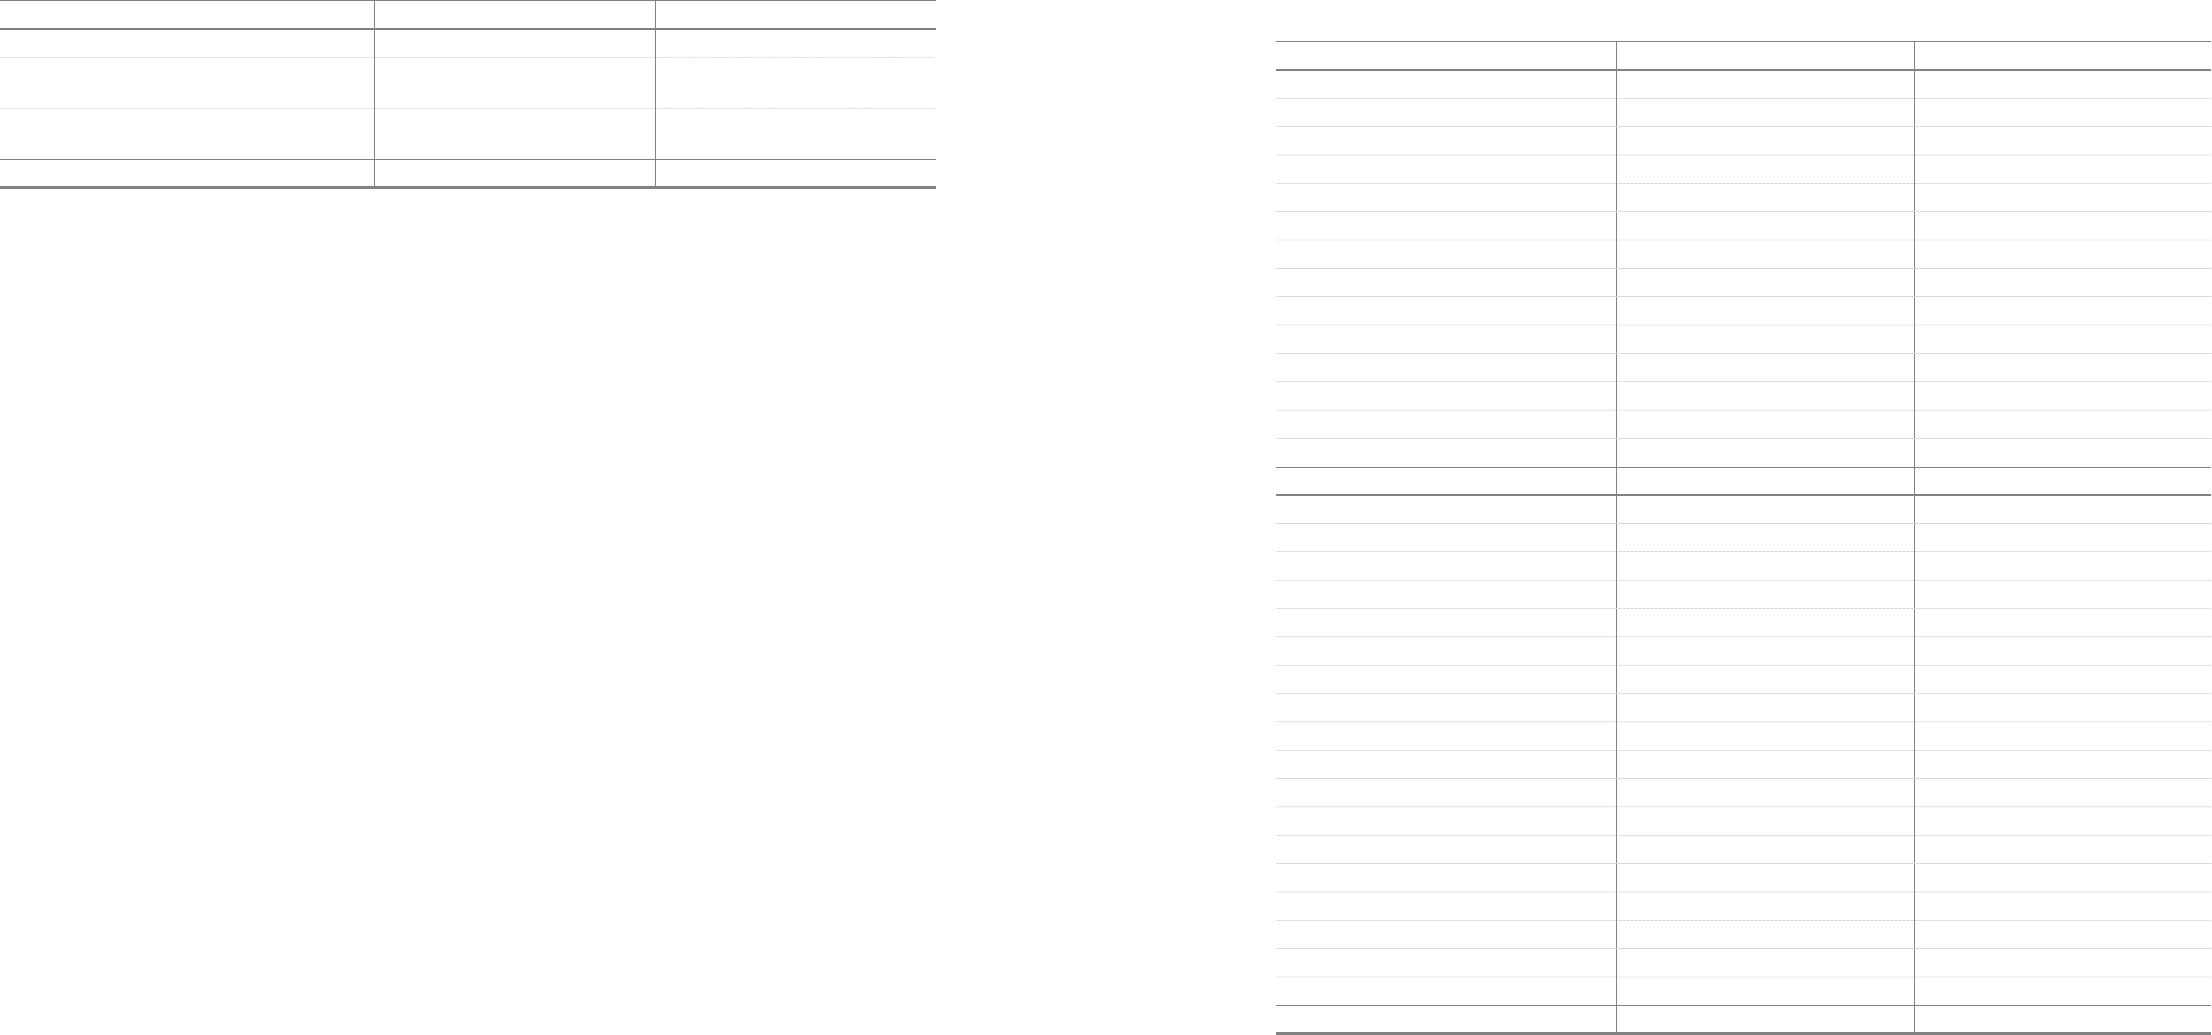
(In millions, except for share amounts) 29. Cash Generated from Operations
a. Cash flows from operating activities as of December 31, 2010 and 2009, consist of the following:
(In millions of Korean Won)
2010 2009
Adjustments for:
Tax expense
₩
3,182,131
₩
2,431,046
Finance income (1,452,502) (2,027,828)
Finance costs 1,425,355 2,019,901
Severance and retirement benefits 563,408 533,411
Depreciation expenses 10,847,374 10,771,334
Amortization expenses 546,522 366,402
Bad debt expenses 115,078 103,325
Gain on valuation of equity method (2,267,091) (1,713,299)
Gain on disposal of property, plant and equipment (282,941) (54,524)
Loss on disposal of property, plant and equipment 276,080 120,133
Obsolescence and scrappage of inventories 1,284,956 458,826
Net additions to provisions 5,426,431 3,025,791
Other income / expense (150,047) 928,948
Adjustments, total
₩
19,514,754
₩
16,963,466
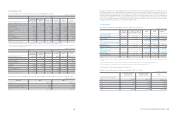
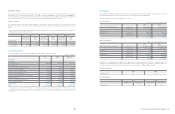
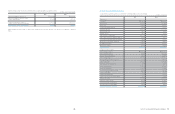
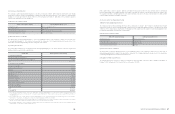
Changes in assets and liabilities:
Increase in trade receivables
₩
(1,798,135)
₩
(5,543,197)
Increase in other receivables (137,460) (621,214)
Decrease / (Increase) in advances 242,472 (209,626)
Increase in prepaid expenses (1,841,462) (1,597,524)
Decrease / (Increase) in other current asset 102,521 (246,799)
Increase in inventories (4,812,756) (1,064,595)
Decrease in other non-current asset 19,683 158,409
Increase in trade payables 1,134,781 3,473,585
Increase in other payables 1,280,376 1,208,380
(Decrease) / Increase in advance received (386,029) 401,156
Increase in withholdings 192,849 262,918
Increase in accrued expenses 1,181,443 393,248
Increase / (Decrease) in other current liabilities 91,143 (16,888)
Utilization of provisions (5,627,981) (2,515,379)
Payment of severance benefits (555,084) (473,422)
Decrease in severance benefit deposit (135,684) (118,930)
Decrease in other non-current liabilities (45,143) (89,318)
Changes in net working capital, total
₩
(11,094,466)
₩
(6,599,196)