Samsung 2010 Annual Report Download - page 34
Download and view the complete annual report
Please find page 34 of the 2010 Samsung annual report below. You can navigate through the pages in the report by either clicking on the pages listed below, or by using the keyword search tool below to find specific information within the annual report.-
 1
1 -
2
-
3
-
4
-
5
-
6
-
7
-
8
-
9
-
10
-
11
-
12
-
13
-
14
-
15
-
16
-
17
-
18
-
19
-
20
-
21
-
22
-
23
-
 24
24 -
 25
25 -
 26
26 -
 27
27 -
 28
28 -
 29
29 -
 30
30 -
 31
31 -
 32
32 -
 33
33 -
 34
34 -
 35
35 -
 36
36 -
 37
37 -
 38
38 -
 39
39 -
 40
40 -
 41
41 -
 42
42 -
 43
43 -
 44
44 -
45
-
46
-
47
-
48
 |
 |
64 65
NOTES TO THE CONSOLIDATED FINANCIAL STATEMENTS
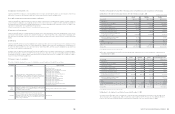
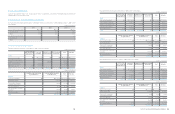
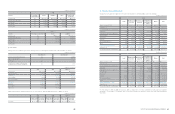
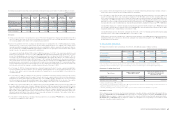
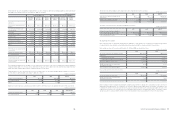
14. Debentures
Debentures as of December 31, 2010, 2009 and January 1, 2009, consist of the following:
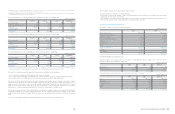
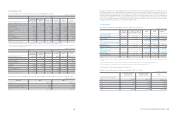
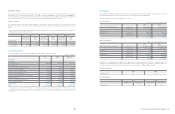
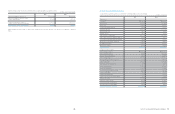
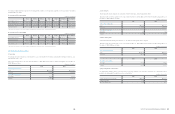
(A) Korean Won denominated debentures as of December 31, 2010, 2009, January 1, 2009, consist of the following:
Korean Won denominated debentures were issued by Samsung Mobile Display, one of SEC’s domestic subsidiaries and included in
consolidation scope since 2009. The debenture issued in 2006 will mature on December 1, 2011 with repayment to be made annually for
two years after a three-year grace period, while the one issued in 2010 is due for repayment at maturity.
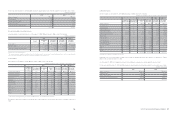
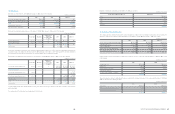
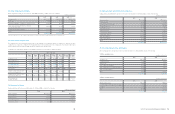
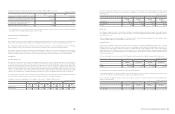
(B) Debentures denominated in foreign currencies as of December 31, 2010, 2009 and January 1, 2009, consist of the following:
US dollar straight bonds will be repaid annually for twenty years after a ten-year grace period from the date of issuance. Interests will be
paid semi-annually.
The carrying value of the debenture issued approximates their fair value.
Issue date Due date
Annual interest
rates (%)
as of December
31, 2010
2010 2009 2009. 1. 1
Samsung Mobile Display 2006.12.01 2011.12.01 5.1
₩
100,000
₩
200,000
₩
-
Samsung Mobile Display 2010.6.17 2013.6.17 4.7 500,000 - -
Total
₩
600,000
₩
200,000
₩
-
Current portion 100,000 100,000 -
Issue date Due date
Annual interest
rates (%)
as of December
31, 2010
2010 2009 2009. 1. 1
US dollar denominated straight bonds 1997.10.2 2027.10.1 7.7
₩
96,807
(USD 85M)
₩
105,084
(USD 90M)
₩
119,463
(USD 95M)
Overseas subsidiaries
US dollar denominated fixed rate notes 1997.4.1 - - - - 31,438
(USD 25M)
US dollar denominated fixed rate notes 2000.4.1 - - - 29,190
(USD 25M)
31,438
(USD 25M)
Less: Discounts (4,010) (4,253) (5,006)
Total
₩
92,797
₩
130,021
₩
177,333
Current portion 5,459 5,838 6,288
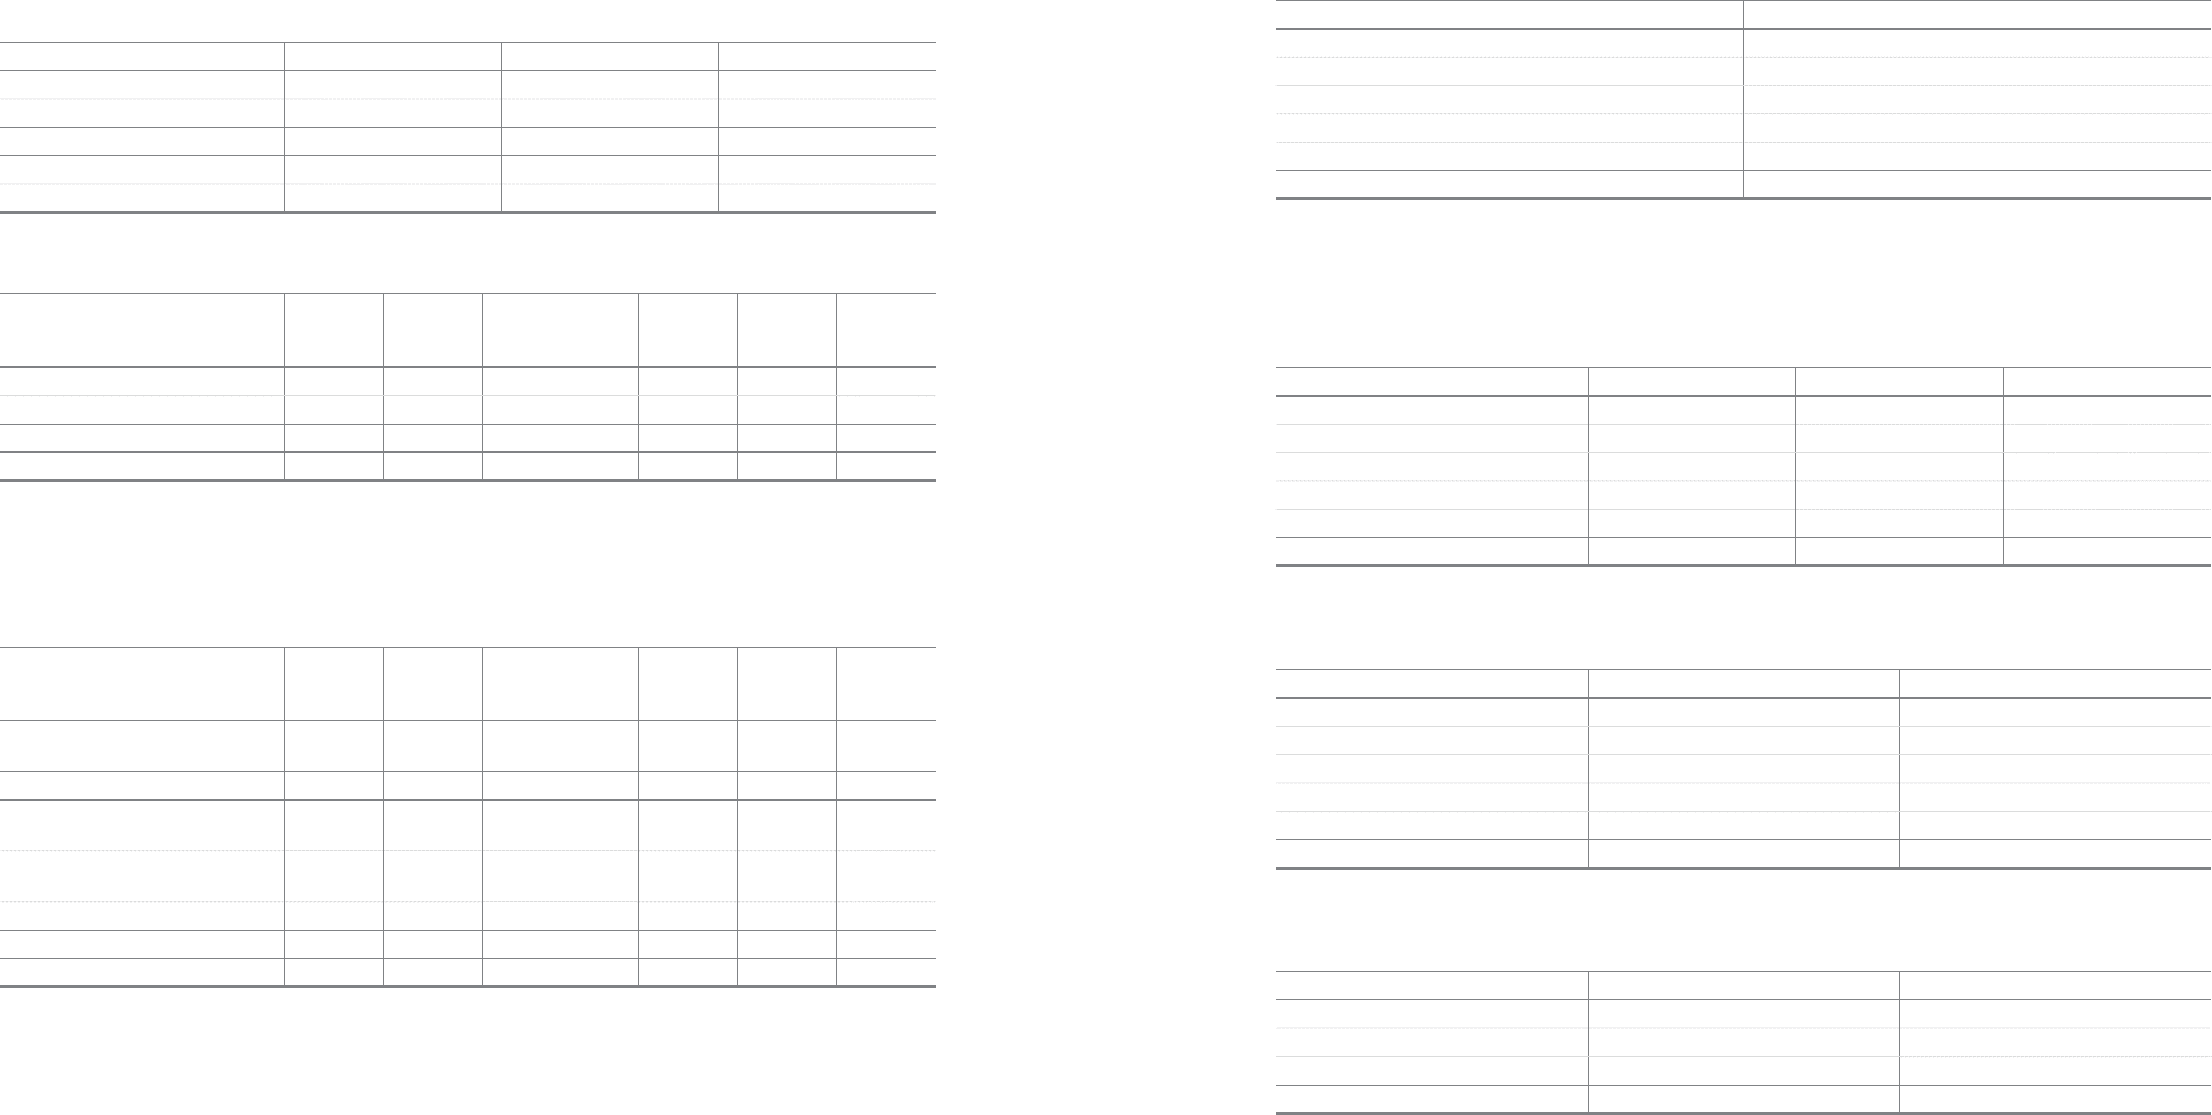
(In millions of Korean Won)
(In millions of Korean Won)
(In millions of Korean Won)
2010 2009 2009.1.1
Korea Won denominated debenture (A)
₩
600,000
₩
200,000
₩
-
Foreign currency denominated debenture (B) 92,797 130,021 177,333
Total
₩
692,797
₩
330,021
₩
177,333
Current portion of debentures 105,459 105,838 6,288
Non-current portion of debentures 587,338 224,183 171,045
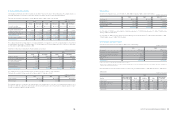
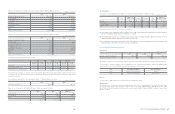
Maturities of debentures outstanding as of December 31, 2010, are as follows:
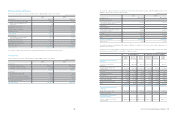
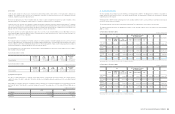
15. Retirement Benefit Obligation
The Company operates defined pension plans in various subsidiaries according to their local regulations and practices in each country. The
amounts recognized in the statement of financial position as of December 31, 2010, 2009 and January 1, 2009, are as follows:
Expense details for defined benefit plans recognized in the statement of income for the years ended December 31, 2010 and 2009, consist
of the following:
The pension expenses related to defined-benefit plans recognized in the statement of income for the years ended December 31, 2010 and
2009, are allocated to the following accounts:
For the years ending December 31 Debentures
2011
₩
105,695
2012 5,695
2013 505,695
2014 5,695
Thereafter 74,027
₩
696,807
2010 2009 2009. 1. 1
Present value of funded defined benefit obligation
₩
2,293,468
₩
2,088,933
₩
1,861,559
Fair value of plan assets (1,797,706) (1,635,056) (1,427,257)
Deficit of funded plans 495,762 453,877 434,302
Present value of unfunded defined benefit 355,164 284,017 396,034
Unrecognized actuarial gains or losses (253,097) 13,373 -
₩
597,829
₩
751,267
₩
830,336
2010 2009
Current service cost
₩
421,343
₩
411,603
Interest cost 148,506 147,860
Expected return on plan assets (76,983) (73,399)
Actuarial gains and losses (2,158) -
The effect of any settlement or curtailment 13,754 -
₩
504,462
₩
486,064
2010 2009
Cost of sales
₩
191,690
₩
256,155
Selling, general and administrative expenses 139,584 103,823
Research and development expenses 173,188 126,086
₩
504,462
₩
486,064
(In millions of Korean Won)
(In millions of Korean Won)
(In millions of Korean Won)
(In millions of Korean Won)