Samsung 2010 Annual Report Download - page 20
Download and view the complete annual report
Please find page 20 of the 2010 Samsung annual report below. You can navigate through the pages in the report by either clicking on the pages listed below, or by using the keyword search tool below to find specific information within the annual report.-
 1
1 -
2
-
3
-
4
-
5
-
6
-
7
-
8
-
9
-
 10
10 -
 11
11 -
 12
12 -
 13
13 -
 14
14 -
 15
15 -
 16
16 -
 17
17 -
 18
18 -
 19
19 -
 20
20 -
 21
21 -
 22
22 -
 23
23 -
 24
24 -
 25
25 -
 26
26 -
 27
27 -
 28
28 -
 29
29 -
 30
30 -
31
-
32
-
33
-
34
-
35
-
36
-
37
-
38
-
39
-
40
-
41
-
42
-
43
-
44
-
45
-
46
-
47
-
48
 |
 |

36 37
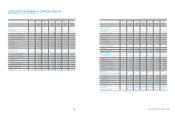
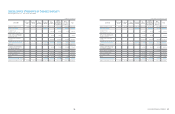
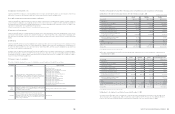
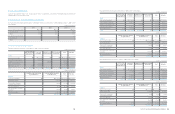
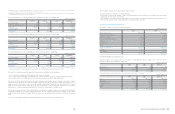
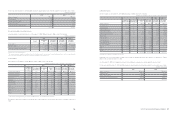
CONSOLIDATED FINANCIAL STATEMENTS
(In millions of Korean Won)
2010 KRW Preferred
stock
Common
stock
Share
premium
Retained
earnings
Other
reserves
Equity
attributable
to owners of
the parent
Non-
controlling
interests
Total
Balance at January 1, 2010 119,467 778,047 4,403,893 71,065,247 (6,801,601) 69,565,053 3,480,149 73,045,202
Profit for the period - - - 15,799,035 - 15,799,035 347,490 16,146,525
Available-for-sale
financial assets, net of tax ----926,428 926,428 5,956 932,384
Share of other comprehensive
income of associates and joint
ventures, net of tax
----387,457 387,457 - 387,457
Foreign currency translation,
net of tax ----(211,802) (211,802) 33,445 (178,357)
Total comprehensive income - - - 15,799,035 1,102,083 16,901,118 386,891 17,288,009
Dividends - - - (1,858,994) - (1,858,994) (71,869) (1,930,863)
Change in ownership interests,
including new stock issues by
consolidated subsidiaries
----- -(49,294) (49,294)
Effect of business combinations ----- -17,647 17,647
Disposal of treasury stock ----1,060,990 1,060,990 - 1,060,990
Stock option activities ----(84,762) (84,762) - (84,762)
Others - - - 9,262 (3,108) 6,154 (3,992) 2,162
Total transactions with owners - - - (1,849,732) 973,120 (876,512) (107,508) (984,120)
Balance at December 31, 2010 119,467 778,047 4,403,893 85,014,550 (4,726,398) 85,589,559 3,759,532 89,349,091
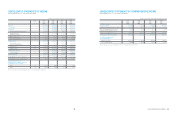
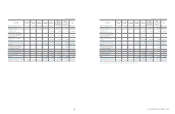
(In thousands of U.S dollars (Note 2.25))
2010 USD Preferred
stock
Common
stock
Share
premium
Retained
earnings
Other
reserves
Equity
attributable
to owners of
the parent
Non-
controlling
interests
Total
Balance at January 1, 2010 104,897 683,157 3,866,795 62,398,145 (5,972,079) 61,080,915 3,055,711 64,136,626
Profit for the period - - - 13,872,188 - 13,872,188 305,110 14,177,298
Available-for-sale
financial assets, net of tax ----813,441 813,441 5,230 818,671
Share of other comprehensive
income of associates and joint
ventures, net of tax
----340,203 340,203 - 340,203
Foreign currency translation,
net of tax ----(185,971) (185,971) 29,366 (156,605)
Total comprehensive income - - - 13,872,188 967,673 14,839,861 339,706 15,179,567
Dividends - - - (1,632,271) - (1,632,271) (63,104) (1,695,375)
Change in ownership interests,
including new stock issues by
consolidated subsidiaries
----- -(43,282) (43,282)
Effect of business combinations ----- -15,495 15,495
Disposal of treasury stock - - - - 931,592 931,592 931,592
Stock option activities ----(74,424) (74,424) (74,424)
Others - - - 8,132 (2,729) 5,403 (3,505) 1,898
Total transactions with owners - - - (1,624,139) 854,439 (769,700) (94,396) (864,096)
Balance at December 31, 2010 104,897 683,157 3,866,795 74,646,194 (4,149,967) 75,151,076 3,301,021 78,452,097
The accompanying notes are an integral part of these consolidated financial statements.