Samsung 2010 Annual Report Download - page 21
Download and view the complete annual report
Please find page 21 of the 2010 Samsung annual report below. You can navigate through the pages in the report by either clicking on the pages listed below, or by using the keyword search tool below to find specific information within the annual report.-
 1
1 -
2
-
3
-
4
-
5
-
6
-
7
-
8
-
9
-
10
-
 11
11 -
 12
12 -
 13
13 -
 14
14 -
 15
15 -
 16
16 -
 17
17 -
 18
18 -
 19
19 -
 20
20 -
 21
21 -
 22
22 -
 23
23 -
 24
24 -
 25
25 -
 26
26 -
 27
27 -
 28
28 -
 29
29 -
 30
30 -
 31
31 -
32
-
33
-
34
-
35
-
36
-
37
-
38
-
39
-
40
-
41
-
42
-
43
-
44
-
45
-
46
-
47
-
48
 |
 |
38 39
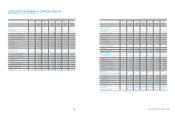
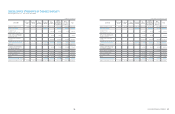
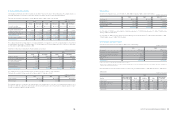
CONSOLIDATED FINANCIAL STATEMENTS
(In millions of Korean Won, in thousands of U.S dollars (Note 2.25))
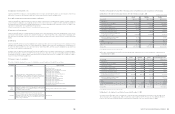
CONSOLIDATED STATEMENTS OF CASH FLOWS
Samsung Electronics Co., Ltd. and its subsidiaries
Notes 2010 2009 2010 2009
KRW KRW USD USD
Cash flows from operating activities
Profit for the period 16,146,525 9,760,550 14,177,298 8,570,155
Adjustments 29 19,514,754 16,963,466 17,134,739 14,894,605
Changes in operating assets and liabilities 29 (11,094,466) (6,599,196) (9,741,387) (5,794,359)
Cash flows from operating activities 24,566,813 20,124,820 21,570,650 17,670,401
Interest received 457,508 301,795 401,710 264,988
Interest paid (582,292) (546,000) (511,276) (479,410)
Dividend received 1,520,037 616,426 1,334,654 541,247
Income tax paid (2,135,287) (1,974,573) (1,874,868) (1,733,754)
Net cash generated from operating activities 23,826,779 18,522,468 20,920,870 16,263,472
Cash flows from investing activities
Net outflow in financial assets at fair value through profit or loss (2,991,820) (5,078,099) (2,626,938) (4,458,775)
Net proceeds (outflow) in short-term available-for-sale financial assets 981,599 (1,117,932) 861,883 (981,589)
Proceeds from disposal of long-term available-for-sale financial assets 9,207 3,111 8,084 2,732
Acquisition of long-term available-for-sale financial assets (414,978) (86,616) (364,367) (76,052)
Proceeds from disposal of associates and joint ventures 277,907 44,832 244,014 39,364
Acquisition of associates and joint ventures (243) (180,916) (213) (158,852)
Purchases of property and equipment (21,619,244) (8,072,165) (18,982,566) (7,087,685)
Proceeds from disposal of property and equipment 1,228,007 100,899 1,078,240 88,593
Purchases of intangible assets (1,259,895) (550,053) (1,106,238) (482,969)
Proceeds from disposal of intangible assets 16,620 56,795 14,593 49,868
Payment for deposits (420,986) (466,323) (369,643) (409,450)
Proceeds from deposits 366,304 482,257 321,630 423,441
Business combination 47,549 290,218 41,750 254,823
Others (204,904) 396,732 (179,916) 348,347
Net cash used in investing activities (23,984,877) (14,177,260) (21,059,687) (12,448,204)
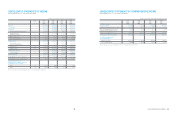
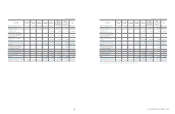
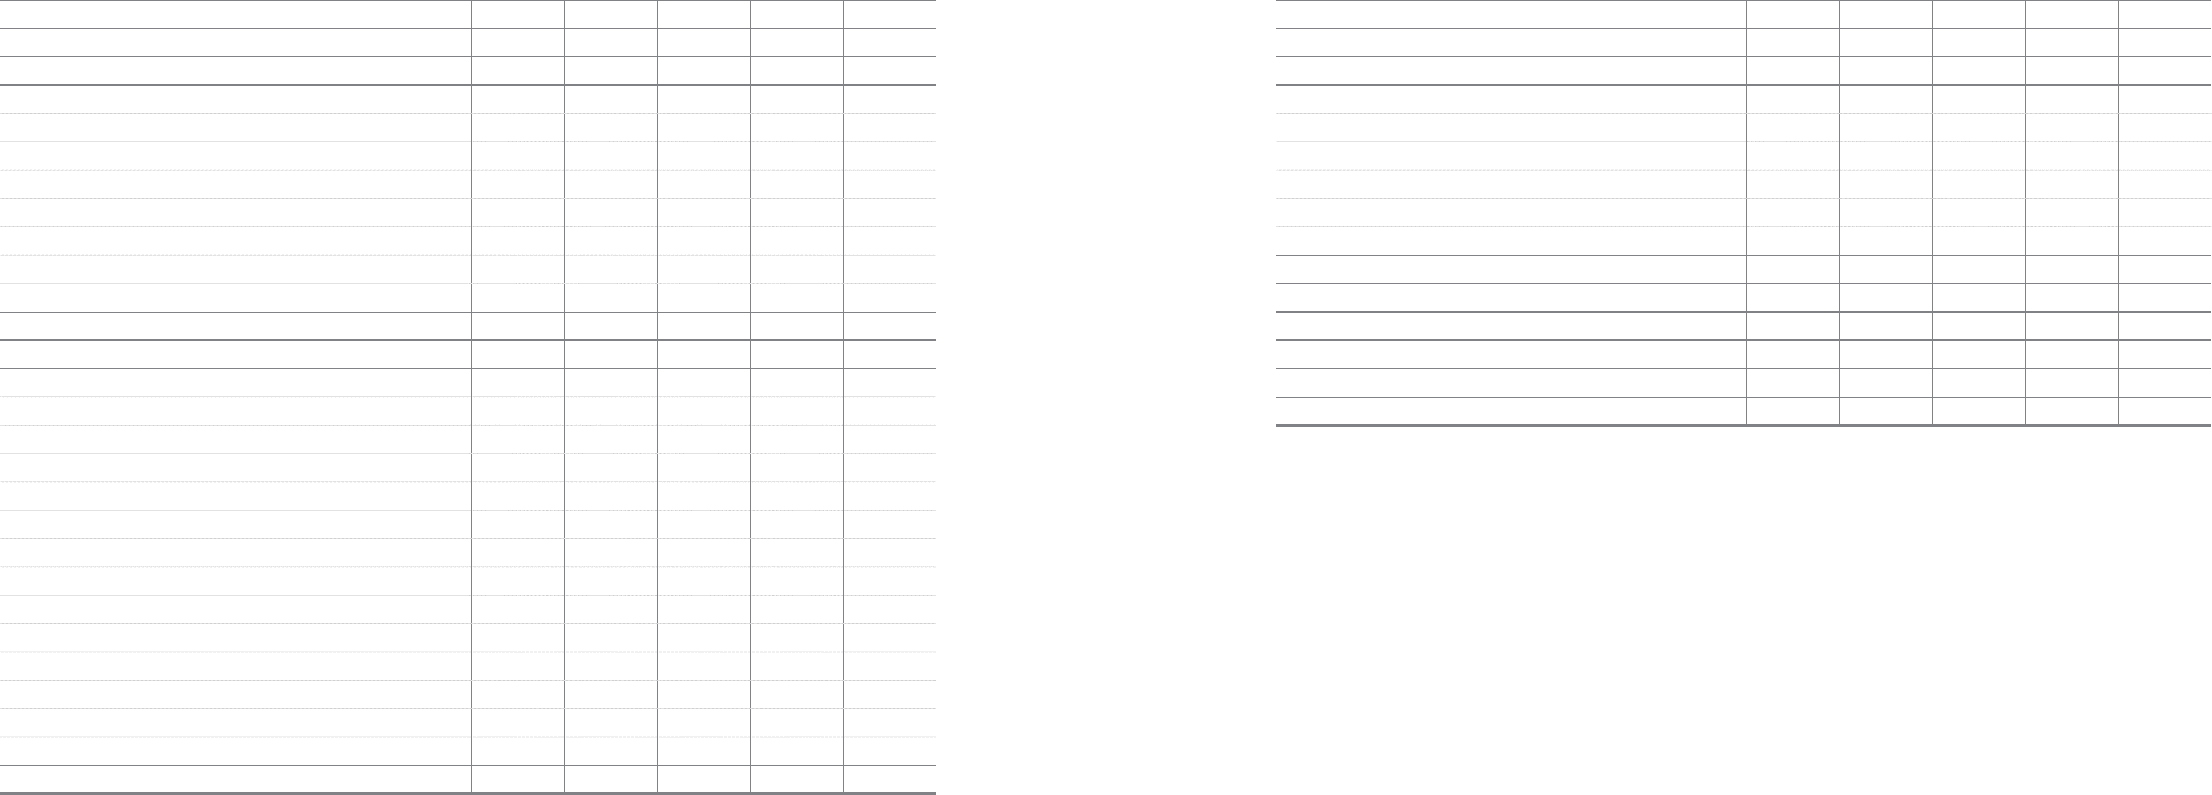
For the years ended December 31,
(In millions of Korean Won, in thousands of U.S dollars (Note 2.25))
Notes 2010 2009 2010 2009
KRW KRW USD USD
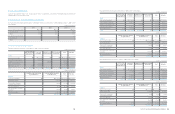
Cash flows from financing activities
Payment of dividends (1,917,637) (823,627) (1,683,762) (723,178)
Proceeds from treasury stock disposal 184,291 330,738 161,815 290,401
Net proceeds from (repayment of) short-term borrowings 868,156 (533,298) 762,276 (468,257)
Repayment of long-term borrowings (304,074) (400,562) (266,989) (351,710)
Proceeds from long-term borrowings 1,137,646 311,500 998,899 273,510
Others (120,677) (248,390) (105,960) (218,096)
Net cash used in financing activities (152,295) (1,363,639) (133,721) (1,197,330)
Effect of exchange rate changes (48,118) 263,995 (42,249) 231,798
Net (decrease) increase in cash and cash equivalents (358,511) 3,245,564 (314,787) 2,849,736
Cash and cash equivalents
Beginning of the year 10,149,930 6,904,366 8,912,047 6,062,311
End of the year 9,791,419 10,149,930 8,597,260 8,912,047
The accompanying notes are an integral part of these consolidated financial statements.