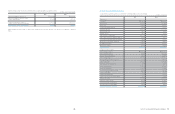
Samsung 2010 Annual Report Download - page 35
Download and view the complete annual report
Please find page 35 of the 2010 Samsung annual report below. You can navigate through the pages in the report by either clicking on the pages listed below, or by using the keyword search tool below to find specific information within the annual report.-
 1
1 -
2
-
3
-
4
-
5
-
6
-
7
-
8
-
9
-
10
-
11
-
12
-
13
-
14
-
15
-
16
-
17
-
18
-
19
-
20
-
21
-
22
-
23
-
24
-
 25
25 -
 26
26 -
 27
27 -
 28
28 -
 29
29 -
 30
30 -
 31
31 -
 32
32 -
 33
33 -
 34
34 -
 35
35 -
 36
36 -
 37
37 -
 38
38 -
 39
39 -
 40
40 -
 41
41 -
 42
42 -
 43
43 -
 44
44 -
 45
45 -
46
-
47
-
48
 |
 |
66 67
NOTES TO THE CONSOLIDATED FINANCIAL STATEMENTS
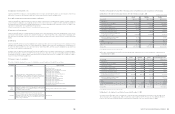
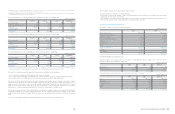
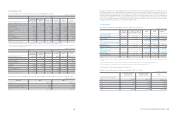
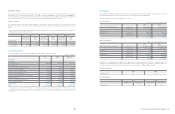
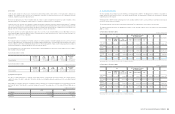
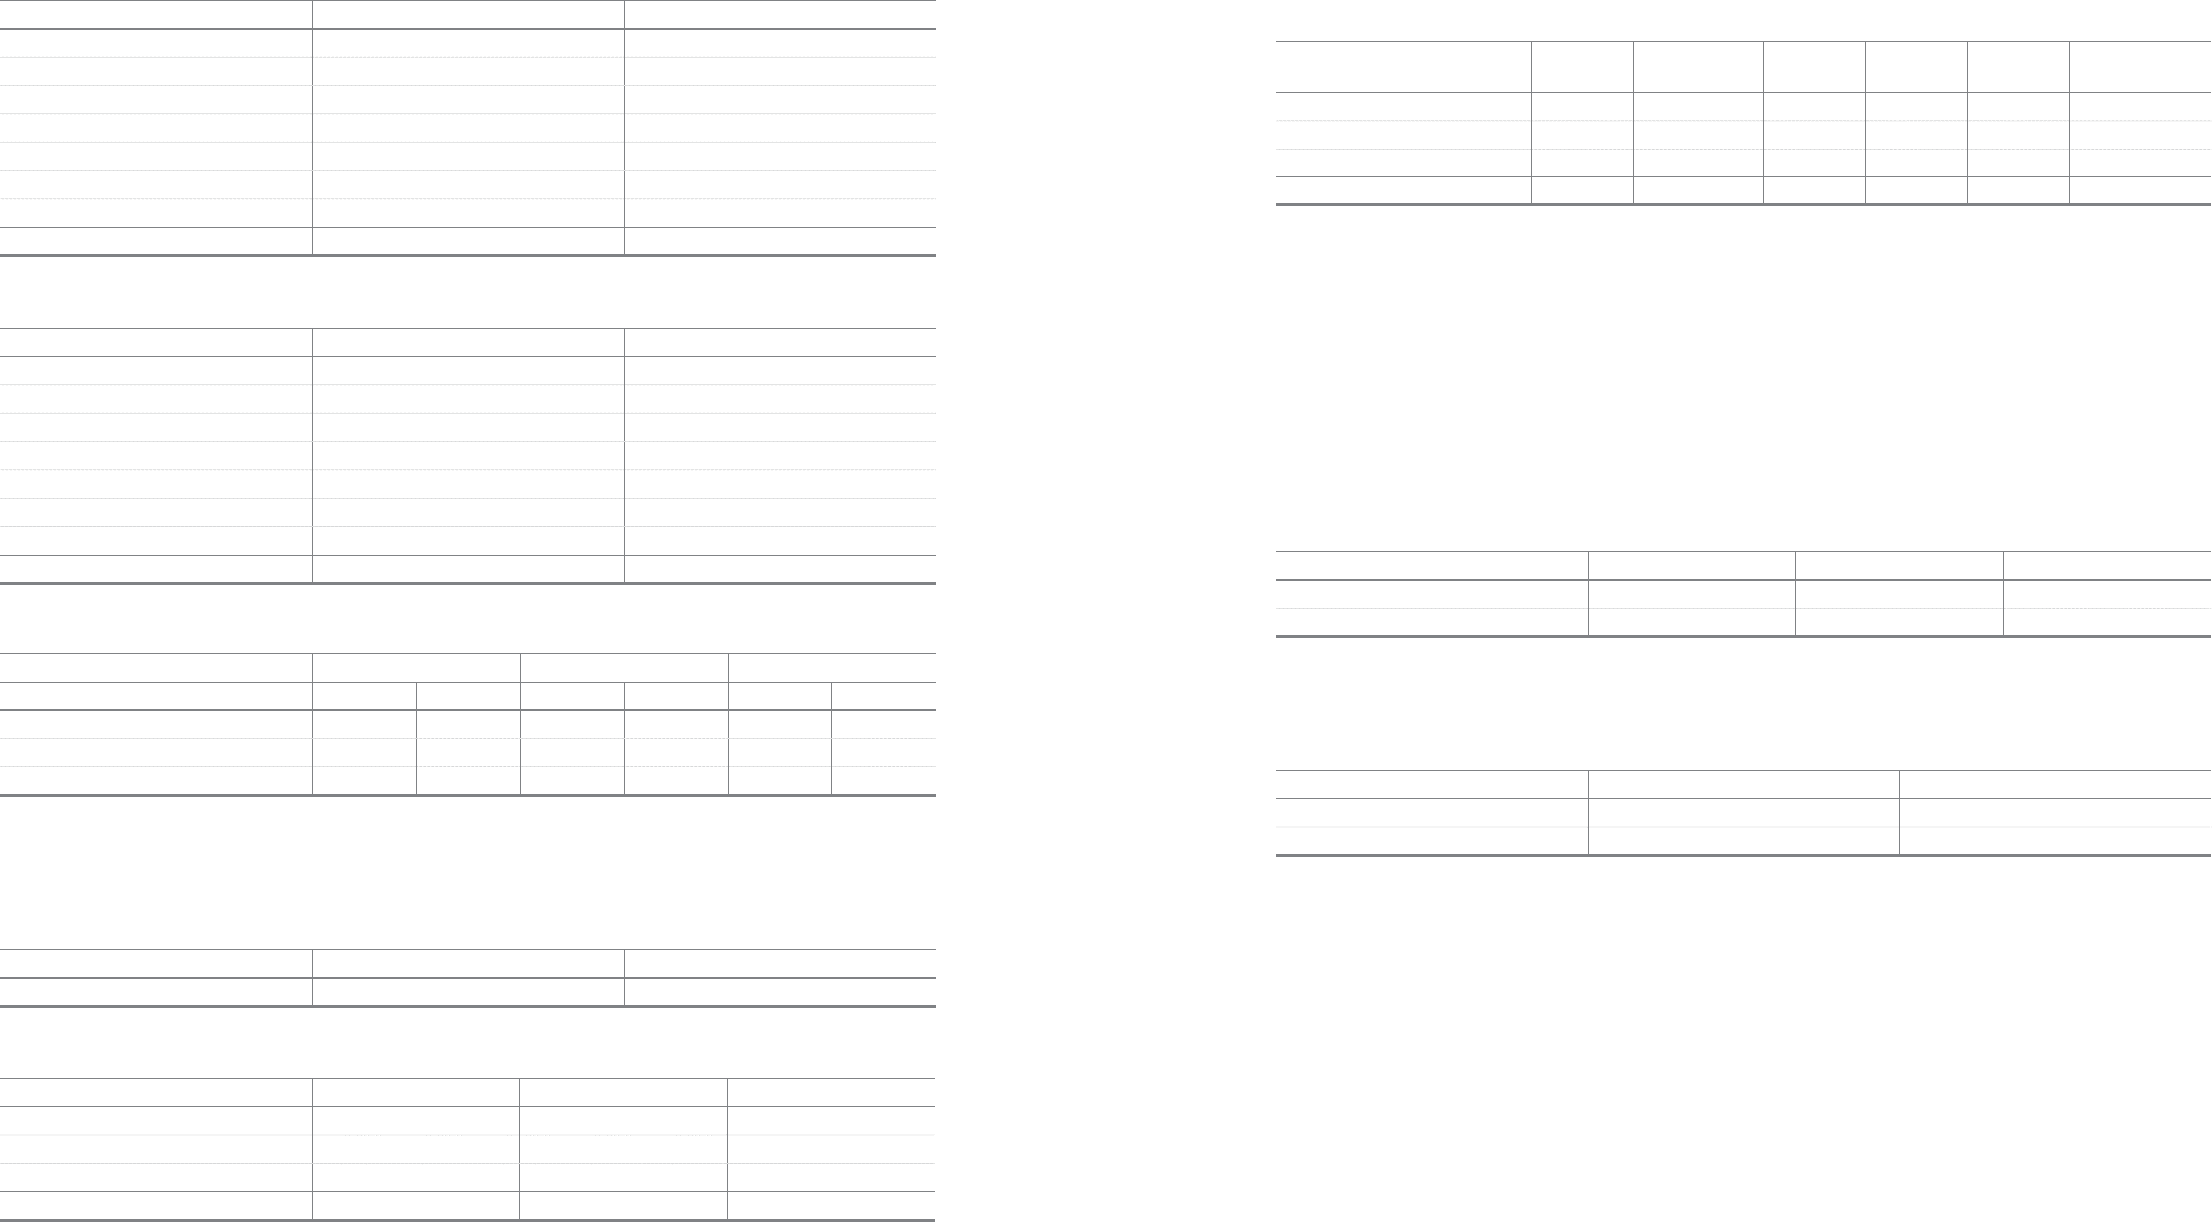
Changes in the defined benefit obligation for the years ended December 31, 2010 and 2009, are as follows:
Changes in the fair value of plan assets for the years ended December 31, 2010 and 2009, are as follows:
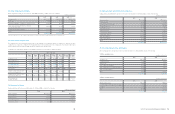
The principal actuarial assumptions used were as follows:
The expected return on plan assets is based on the expected return multiplied with the respective percentage weight of the market-related
value of plan assets. The expected return is defined on a uniform basis, reflecting long-term historical returns, current market conditions and
strategic asset allocation.
The actual returns on plan assets for the years ended December 31, 2010 and 2009, were as follows:
Plan assets as of December 31, 2010, 2009 and January 1, 2009, are comprised as follows:
2010 2009
Balance at the beginning of the year
₩
2,372,950
₩
2,257,593
Foreign exchange 15,416 16,325
Current service cost 421,343 411,603
Interest cost 148,506 147,860
Actuarial gains and losses 251,936 (21,273)
Benefits paid (555,084) (473,422)
Others (6,435) 34,264
Balance at the end of the year
₩
2,648,632
₩
2,372,950
2010 2009
Balance at the beginning of the year
₩
1,635,056
₩
1,427,257
Foreign exchange (4,707) (1,031)
Expected return on plan assets 79,219 75,635
Actuarial gains and losses (12,376) (7,900)
Contributions by the employer 422,567 295,845
Benefits paid (287,535) (155,679)
Others (34,518) 929
Balance at the end of the year
₩
1,797,706
₩
1,635,056
2010 2009
The actual return on plan assets
₩
66,843
₩
67,735
(In millions of Korean Won)
(In millions of Korean Won)
(In millions of Korean Won)
(In millions of Korean Won)
(In %)
2010 2009 2009. 1. 1
Domestic Foreign Domestic Foreign Domestic Foreign
Discount rate 6.3~7.3 6.0~7.5 6.5~7.5 5.9~8.5 6.5~7.5 5.4~7.5
Expected return on plan assets 5.0~5.3 5.0~5.3 5.0~5.5 5.0~5.3 5.0~5.5 5.0~5.5
Future salary increases (Including inflation) 5.3~9.4 5.1~6.0 5.2~7.8 5.5~6.0 5.5~7.5 5.9~6.0
2010 2009 2009. 1. 1
Equity instruments
₩
2,935
₩
1,740
₩
-
Debt instruments 1,761,884 1,596,267 1,418,312
Other 32,887 37,049 8,945
₩
1,797,706
₩
1,635,056
₩
1,427,257
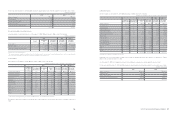
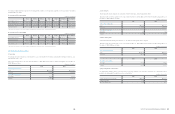
16. Provisions
The changes in the main liability provisions during the 12 month period ended December 31, 2010, are as follows:
(A) The Company accrues warranty reserves for estimated costs of future service, repairs and recalls, based on historical experience
and terms of warranty programs (which have terms from 1 to 4 years).
(B) The Company makes provisions for estimated royalty expenses related to technical assistance agreements that have not been
settled. The timing of payment depends on the settlement of agreement.
(C) The Company has a long-term incentive plans for its executives based on a three-year management performance criteria and has
made a provision for the estimated incentive cost for the accrued period.
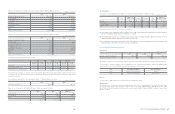
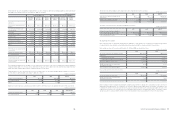
17. Commitments and Contingencies
(A) Guarantees
The guarantees of debt for housing rental relate to guarantees provided by the Company to landlords for housing for expatriate employees.
As of December 31, 2010, the Company’s overseas subsidiaries enter into “Cash Pooling Arrangement” contracts and “Banking Facility”
agreements with overseas financial institutions to provide mutual guarantees of indebtedness.
(B) Lease
As of December 31, 2010, details of lease contracts held by the Company are as follows:
Finance lease
The Company leases certain property, plant and equipment under various finance lease arrangements. Assets recorded under finance
lease agreements are included in property, plant and equipment with a net book value of
₩
109,838 million (2009:
₩
102,971 million, 2008:
₩
52,857 million). Depreciation expense for the finance lease assets amounted to
₩
6,817 million (2009:
₩
5,135 million) for the year ended
December 31, 2010.
Ref. Balance at
January 1, 2010 Increase Decrease Other1Balance at
December 31, 2010
Warranty (A)
₩
1,442,088
₩
1,765,182
₩
(1,560,227)
₩
(13,537)
₩
1,633,506
Royalty expenses (B) 1,560,955 1,261,464 (1,821,301) (12,061) 989,057
Long-term incentives (C) 244,443 389,079 (42,810) - 590,712
Total
₩
3,247,486
₩
3,415,725
₩
(3,424,338)
₩
(25,598)
₩
3,213,275
(In millions of Korean Won)
(In millions of Korean Won)
1 Others include amounts from changes in foreign currency exchange rates.
2010 2009 2009. 1. 1
Guarantees of debt for housing rental1
₩
171,674
₩
138,848
₩
250,132
Other domestic guarantees of debt - 9,791 10,312
Area Participating subsidiaries Financial institutions
Europe SEUK and 25 other subsidiaries Citibank
Asia SAPL and 9 other subsidiaries Bank of America