Samsung 2010 Annual Report Download - page 30
Download and view the complete annual report
Please find page 30 of the 2010 Samsung annual report below. You can navigate through the pages in the report by either clicking on the pages listed below, or by using the keyword search tool below to find specific information within the annual report.-
 1
1 -
2
-
3
-
4
-
5
-
6
-
7
-
8
-
9
-
10
-
11
-
12
-
13
-
14
-
15
-
16
-
17
-
18
-
19
-
 20
20 -
 21
21 -
 22
22 -
 23
23 -
 24
24 -
 25
25 -
 26
26 -
 27
27 -
 28
28 -
 29
29 -
 30
30 -
 31
31 -
 32
32 -
 33
33 -
 34
34 -
 35
35 -
 36
36 -
 37
37 -
 38
38 -
 39
39 -
 40
40 -
41
-
42
-
43
-
44
-
45
-
46
-
47
-
48
 |
 |
56 57
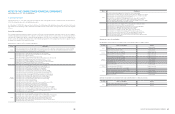
NOTES TO THE CONSOLIDATED FINANCIAL STATEMENTS
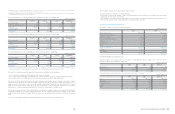
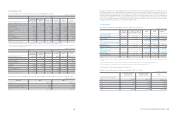
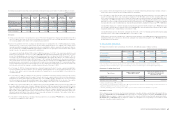
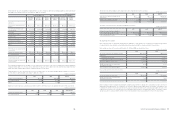
For the years ended December 31, 2010 and 2009, changes in valuation gain (loss) on short-term available-for-sale securities are as follows:
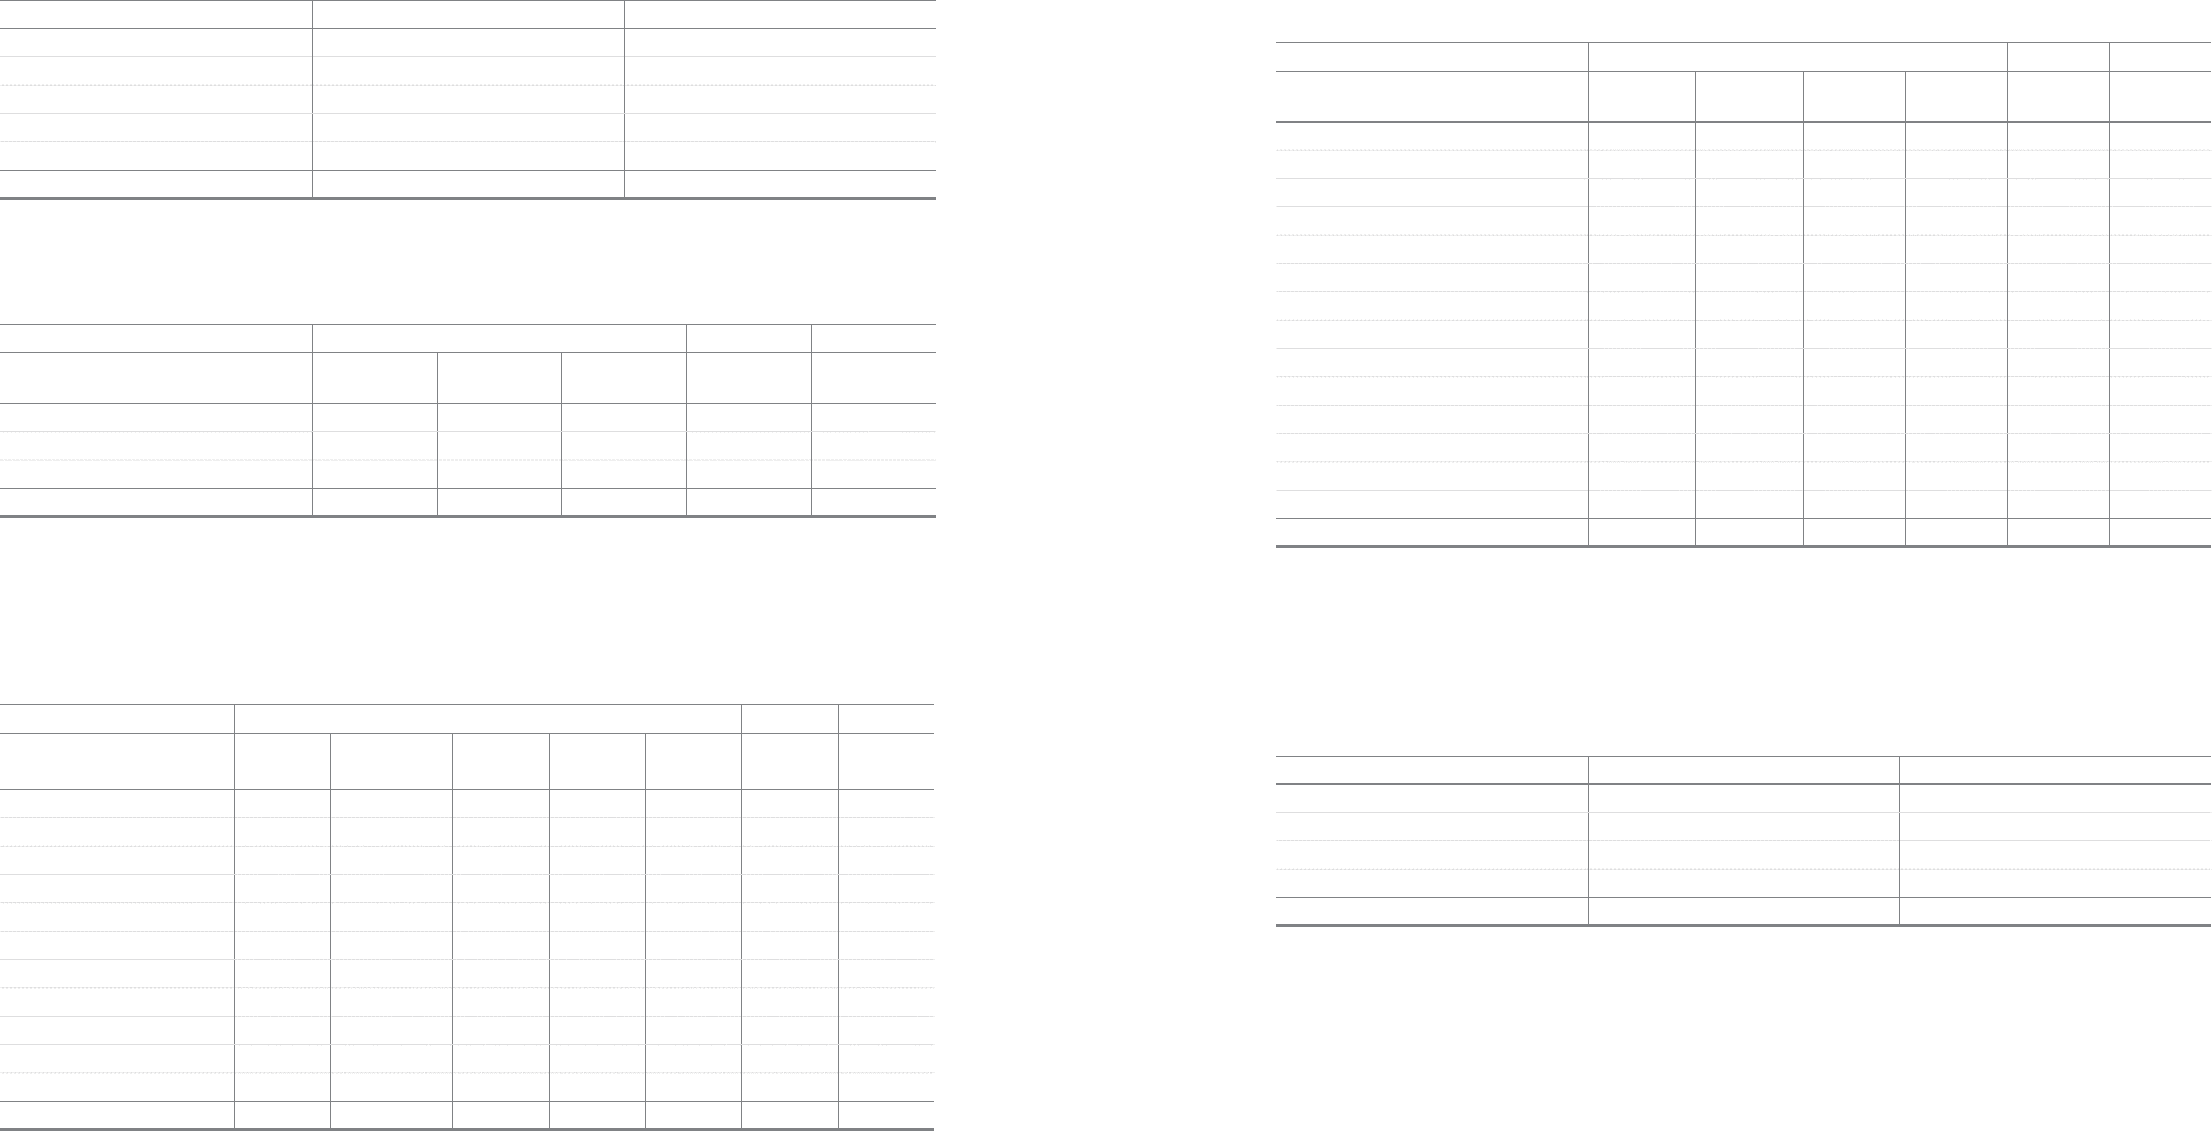
(2) Long-term available-for-sale financial assets
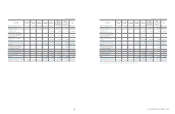
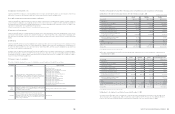
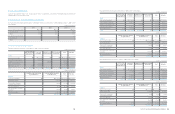
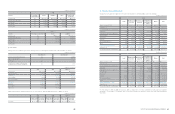
Long-term available-for-sale financial assets as of December 31, 2010, 2009 and January 1, 2009, consist of the following:
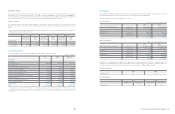
1) Listed equities
Listed equities as of December 31, 2010, 2009 and January 1, 2009, consist of the following:
The differences between the acquisition cost and fair value of the investment is recorded under other reserves, a separate component of
equity.
2010 2009 2009. 1. 1
Detail Acquisition
cost
Recorded
book value
Recorded
book value
Recorded
book value
Listed equities 11)
₩
703,138
₩
2,664,082
₩
1,229,669
₩
1,069,304
Non-listed equities 1, 22) 234,894 326,359 228,973 197,861
Government and public bonds and others 49,765 49,765 30,496 1,770
₩
987,797
₩
3,040,206
₩
1,489,138
₩
1,268,935
2010 2009 2009. 1. 1
Number
of shares
owned
Percentage of
ownership (%)
Acquisition
cost
Market
value
Recorded
book value
Recorded
book value
Recorded
book value
Samsung Heavy Industries 40,675,641 17.6
₩
258,299
₩
1,675,836
₩
1,675,836
₩
984,350
₩
919,269
Samsung Fine Chemicals 2,164,970 8.4 45,678 179,476 179,476 101,862 83,243
Samsung Life Insurance¹ 1,315,880 0.7 92,112 134,878 134,878 - -
iMarket Korea¹ 3,800,000 10.6 1,900 103,360 103,360 - -
Hotel Shilla 2,004,717 5.0 13,957 55,631 55,631 41,297 25,761
Cheil Worldwide 2,998,725 2.6 2,920 41,532 41,532 37,784 23,390
A-Tech Solution 1,592,000 15.9 26,348 33,432 33,432 32,636 -
SFA 1,822,000 10.0 38,262 89,278 89,278 - -
SNU Pricision 1,075,446 5.3 14,204 18,874 18,874 - -
Rambus 9,576,250 8.3 185,363 223,363 223,363 - -
Others 24,095 108,422 108,422 31,740 17,641
₩
703,138
₩
2,664,082
₩
2,664,082
₩
1,229,669
₩
1,069,304
(In millions of Korean Won)
(In millions of Korean Won, except for the number of shares and percentage)
1 Excludes associates and joint ventures.
2 The company measures available-for-sale financial assets, at their fair values. For an investment in equity instruments that do not have a quoted market
price in an active market and its fair value cannot be measured reliably, it is measured at cost.
1 Certain investees including Samsung Life Insurance and iMarket Korea, were listed during the current year.
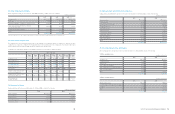
2010 2009
Balance at January 1
₩
4,420
₩
12,067
Valuation amount 9,144 4,420
Net gains transfer from equity 4,420 12,067
Balance at December 31 9,144 4,420
Deferred income tax and minority interest (2,213) (1,070)
₩
6,931
₩
3,350
(In millions of Korean Won)
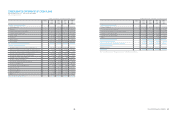
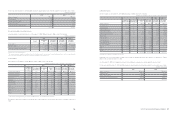
2) Non-listed equities
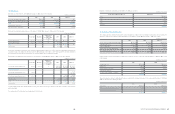
Non-listed equities as of December 31, 2010, 2009 and January 1, 2009, consist of the following:
Impairment losses on non-listed equities resulting from the decline in realizable value below the acquisition cost amounted to
10,719
million for the year ended December 31, 2010.
As of December 31, 2010, the Company’s investments in Pusan Newport are pledged as collateral against the investee's debt.
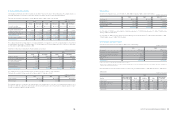
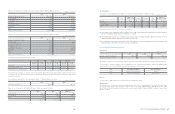
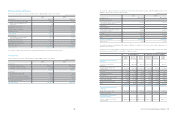
For the years ended December 31, 2010 and 2009, changes in valuation gain (loss) on long-term available-for-sale securities are as follows:
2010 2009 2009. 1. 1
Number of
shares owned
Percentage of
ownership (%)
Acquisition
cost
Recorded
book value
Recorded
book value
Recorded
book value
Kihyup Technology 1,000,000 17.2
₩
5,000
₩
5,000
₩
5,000
₩
5,000
Pusan Newport 1,135,307 1.0 5,677 5,677 5,677 5,677
Samsung Venture 980,000 16.3 4,900 5,223 4,900 4,900
Samsung Life Insurance - - - - 92,112 92,112
Samsung Petrochemical 514,172 13.0 8,040 58,940 8,040 8,040
Samsung General Chemicals 1,914,251 3.9 19,143 65,322 13,864 13,864
iMarket Korea - - - - 1,900 1,900
icube Investment 40 16.2 4,000 4,000 4,000 -
Yong Pyong Resort 400,000 1.1 1,869 1,869 1,869 1,869
Korea Digital Satellite 240,000 0.7 3,344 3,000 3,000 3,000
SK Telink (TU Media)¹ 14,609 1.1 4,357 4,357 15,076 15,076
Nanosys 13,100,436 12.5 17,861 17,861 - -
WIC 600,000 18.5 60,000 60,000 - -
Others 100,703 95,110 73,535 46,423
₩
234,894
₩
326,359
₩
228,973
₩
197,861
1 TU Media was merged into SK Telink in the year 2010.
2010 2009
Balance at January 1
₩
874,036
₩
734,819
Valuation amount 1,184,153 139,217
Balance at December 31 2,058,189 874,036
Deferred income tax and minority interest (457,085) (195,778)
₩
1,601,104
₩
678,258
(In millions of Korean Won, except for the number of shares and percentage)
(In millions of Korean Won)