Samsung 2010 Annual Report Download - page 28
Download and view the complete annual report
Please find page 28 of the 2010 Samsung annual report below. You can navigate through the pages in the report by either clicking on the pages listed below, or by using the keyword search tool below to find specific information within the annual report.-
 1
1 -
2
-
3
-
4
-
5
-
6
-
7
-
8
-
9
-
10
-
11
-
12
-
13
-
14
-
15
-
16
-
17
-
 18
18 -
 19
19 -
 20
20 -
 21
21 -
 22
22 -
 23
23 -
 24
24 -
 25
25 -
 26
26 -
 27
27 -
 28
28 -
 29
29 -
 30
30 -
 31
31 -
 32
32 -
 33
33 -
 34
34 -
 35
35 -
 36
36 -
 37
37 -
 38
38 -
39
-
40
-
41
-
42
-
43
-
44
-
45
-
46
-
47
-
48
 |
 |
52 53
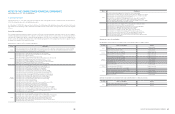
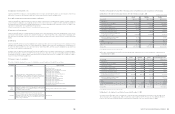
NOTES TO THE CONSOLIDATED FINANCIAL STATEMENTS
4. Cash and Cash Equivalent
Cash and cash equivalents include cash on hand, deposits held at call with banks, and other short-term highly liquid investments with
original maturities of less than three months.
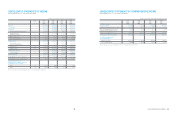
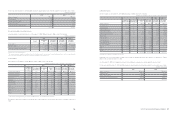
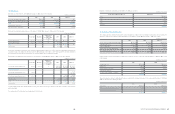
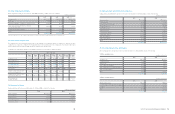
5. Financial Assets Subject to Withdrawal Restrictions
Short and long-term financial instruments subject to withdrawal restrictions as of December 31, 2010, 2009 and January 1, 2009, consist
of the following:
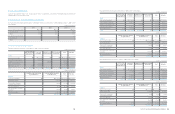
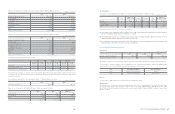
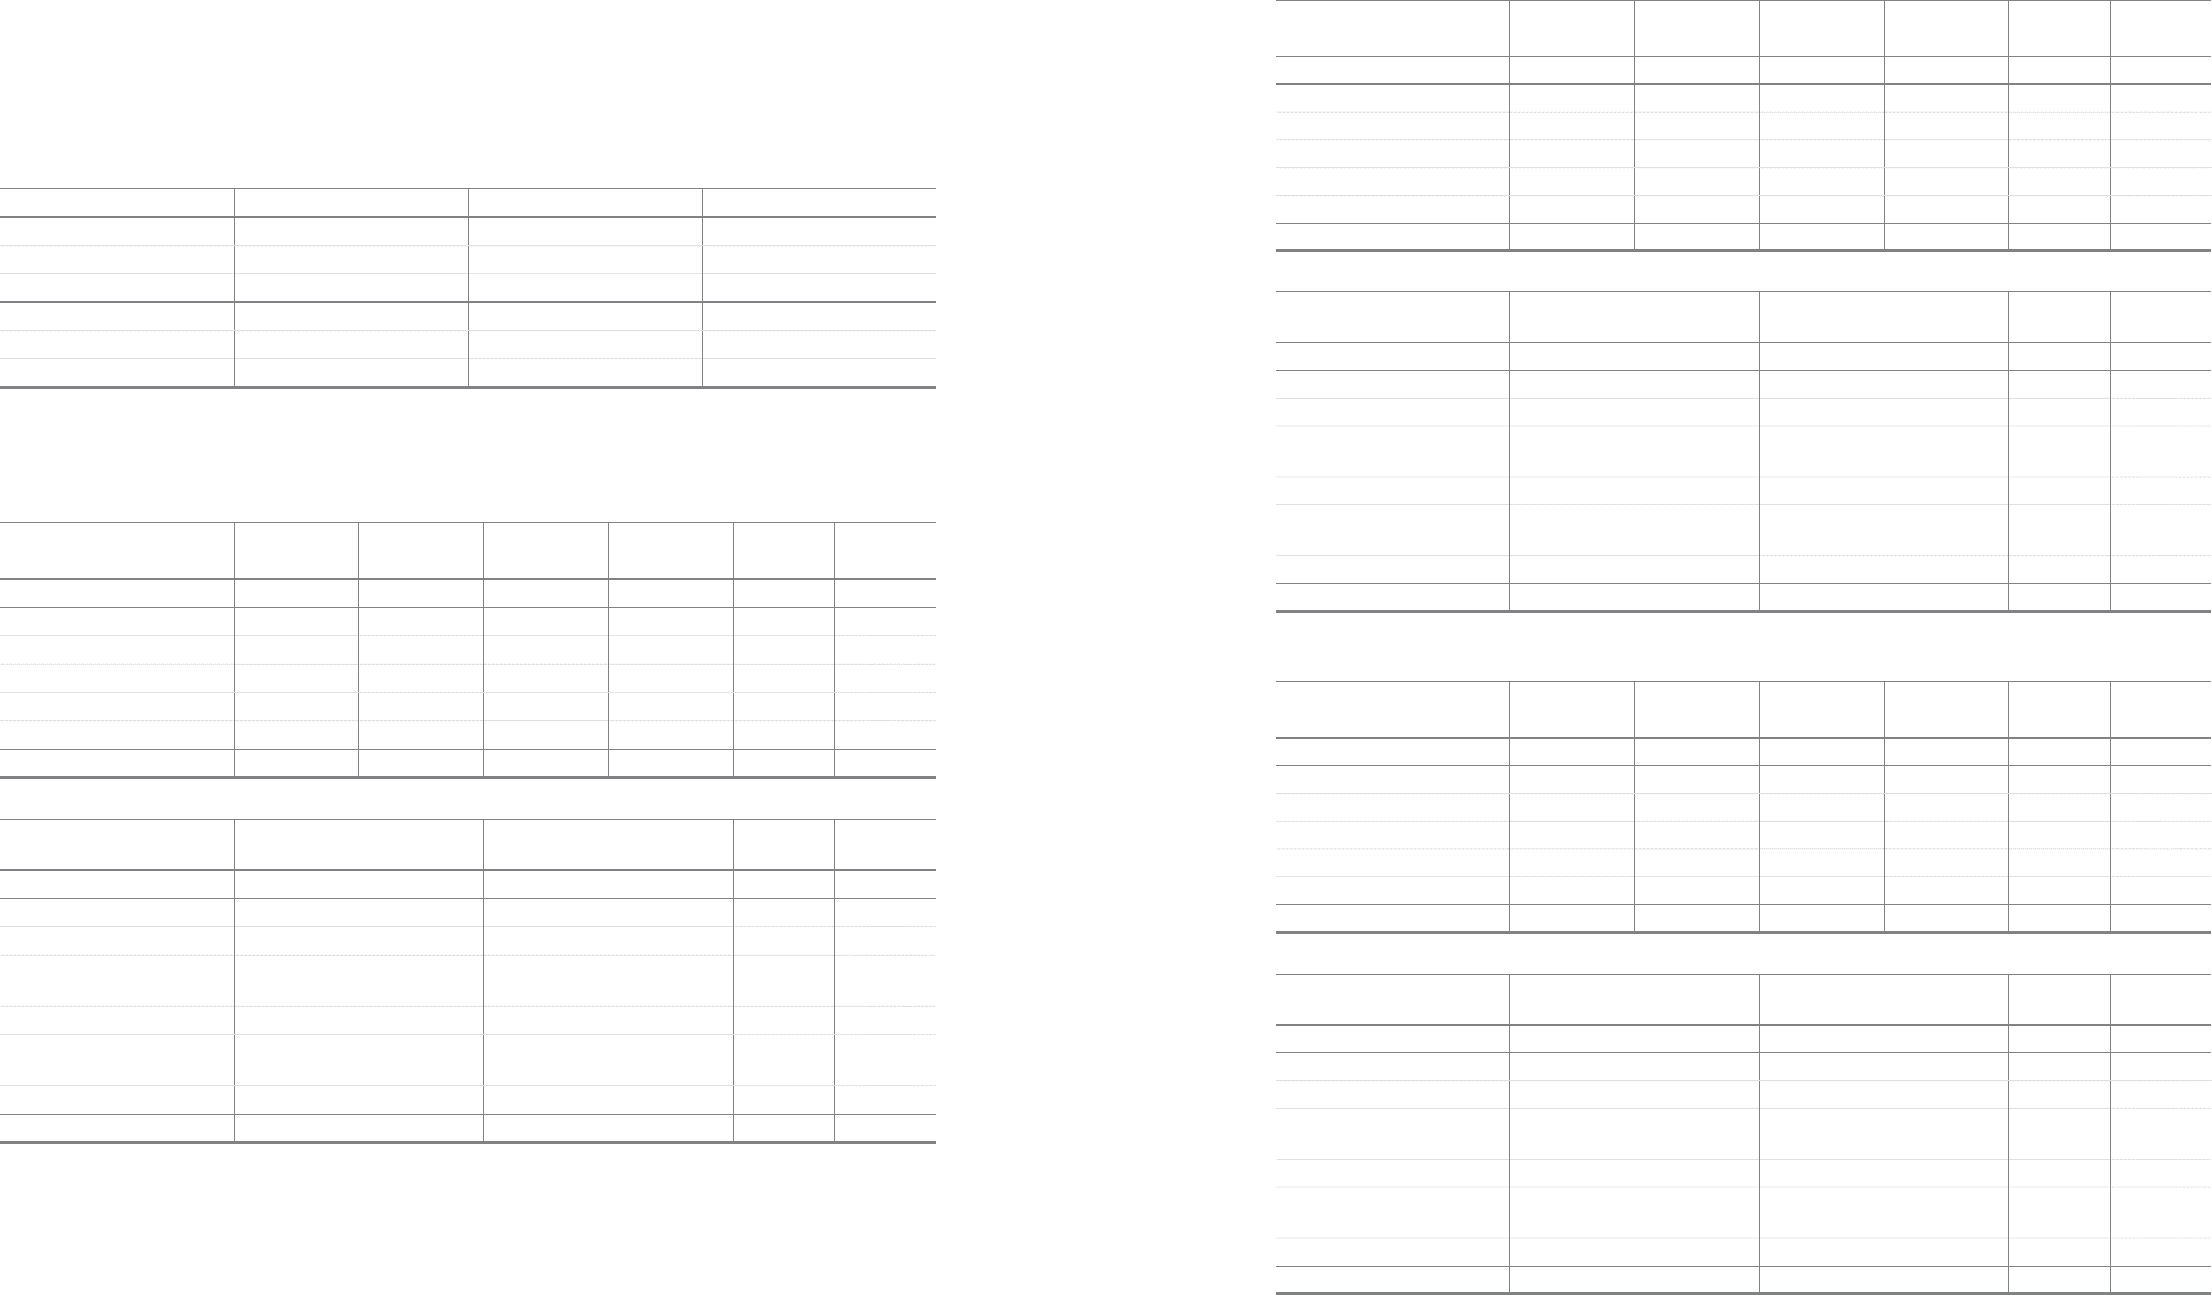
6. Financial Instruments by Category
Financial instruments by category as of December 31, 2010, consist of the following:
(In millions of Korean Won)
(In millions of Korean Won)
(In millions of Korean Won)
2010 2009 2009. 1. 1
(1) Short-term financial instruments
₩
46,371
₩
69,165
₩
37,680
Government grant 32,923 54,336 24,505
Others 13,448 14,829 13,175
(2) Long-term financial instrument 26 26 20
Special deposit 18 18 11
Others 8 8 9
Assets at fair
value through the
profit and loss
Loans and
receivables
Available-for-sale
financial assets
Held-to-maturity
investments Total Fair value
Assets
Cash and cash equivalents
₩
-
₩
9,791,419
₩
-
₩
-
₩
9,791,419
₩
9,791,419
Short-term financial instruments - 11,529,392 - - 11,529,392 11,529,392
Available-for-sale financial assets - - 4,199,358 - 4,199,358 4,199,358
Trade and other receivables - 21,308,834 - - 21,308,834 21,308,834
Other financial assets (*) 34,458 1,669,433 - - 1,703,891 1,703,891
Total
₩
34,458
₩
44,299,078
₩
4,199,358
₩
-
₩
48,532,894
₩
48,532,894
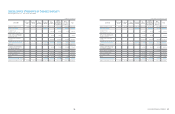
Liabilities at fair value through
the profit and loss
Financial liabilities measured
at amortized cost Total Fair value
Liabilities
Trade and other payables
₩
-
₩
16,049,800
₩
16,049,800
₩
16,049,800
Short-term borrowings 8,429,721 8,429,721 8,429,721
Current portion of long-term
borrowings and debentures 1,123,934 1,123,934 1,123,934
Non-current debentures - 587,338 587,338 587,338
Non-current portion of long-term
borrowings - 634,381 634,381 634,381
Other financial liabilities (**) 24,638 8,862,228 8,886,866 8,886,866
Total
₩
24,638
₩
35,687,402
₩
35,712,040
₩
35,712,040
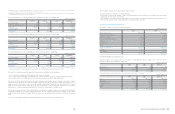
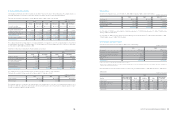
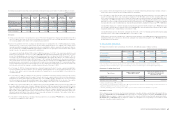
Financial instruments by category as of December 31, 2009, consist of the following:
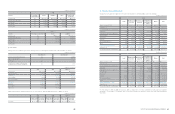
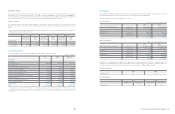
Financial instruments by category as of January 1, 2009, consist of the following:
Assets at fair
value through the
profit and loss
Loans and
receivables
Available-for-sale
financial assets
Held-to-maturity
investments Total Fair value
Assets
Cash and cash equivalents
₩
-
₩
10,149,930
₩
-
₩
-
₩
10,149,930
₩
10,149,930
Short-term finance instruments - 8,629,113 - - 8,629,113 8,629,113
Available-for-sale financial assets - - 3,593,558 - 3,593,558 3,593,558
Trade and other receivables - 19,796,779 - - 19,796,779 19,796,779
Other financial assets (*) 16,242 1,404,935 - - 1,421,177 1,421,177
Total
₩
16,242
₩
39,980,757
₩
3,593,558
₩
-
₩
43,590,557
₩
43,590,557
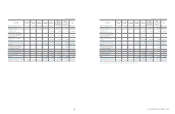
Liabilities at fair value through
the profit and loss
Financial liabilities measured
at amortized cost Total Fair value
Liabilities
Trade and other payables
₩
-
₩
13,542,626
₩
13,542,626
₩
13,542,626
Short-term borrowings - 7,780,007 7,780,007 7,780,007
Current portion of long-term
borrowings and debentures - 234,327 234,327 234,327
Non-current debentures - 224,183 224,183 224,183
Non-current portion of long-term
borrowings - 1,156,094 1,156,094 1,156,094
Other financial liabilities (**) 15,122 7,778,445 7,793,567 7,793,567
Total
₩
15,122
₩
30,715,682
₩
30,730,804
₩
30,730,804
(In millions of Korean Won)
(In millions of Korean Won)
(In millions of Korean Won)
Assets at fair
value through the
profit and loss
Loans and
receivables
Available-for-sale
financial assets
Held-to-maturity
investments Total Fair value
Assets
Cash and cash equivalents
₩
-
₩
6,904,366
₩
-
₩
-
₩
6,904,366
₩
6,904,366
Short-term finance instruments - 3,575,942 - - 3,575,942 3,575,942
Available-for-sale financial assets - - 2,251,002 - 2,251,002 2,251,002
Trade and other receivables - 15,366,544 - - 15,366,544 15,366,544
Other financial assets (*) 59,105 1,365,039 - - 1,424,144 1,424,144
Total
₩
59,105
₩
27,211,891
₩
2,251,002
₩
-
₩
29,521,998
₩
29,521,998
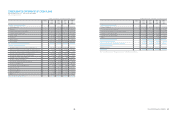
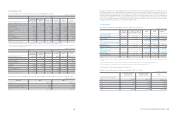
Liabilities at fair value through
the profit and loss
Financial liabilities measured
at amortized cost Total Fair value
Liabilities
Trade and other payables
₩
-
₩
10,123,749
₩
10,123,749
₩
10,123,749
Short-term borrowings - 9,054,543 9,054,543 9,054,543
Current portion of long-term
borrowings and debentures - 20,449 20,449 20,449
Non-current debentures - 171,045 171,045 171,045
Non-current portion of long-term
borrowings - 969,839 969,839 969,839
Other financial liabilities (**) 63,119 6,228,010 6,291,129 6,291,129
Total
₩
63,119
₩
26,567,635
₩
26,630,754
₩
26,630,754
(In millions of Korean Won)