Samsung 2010 Annual Report Download - page 2
Download and view the complete annual report
Please find page 2 of the 2010 Samsung annual report below. You can navigate through the pages in the report by either clicking on the pages listed below, or by using the keyword search tool below to find specific information within the annual report.-
 1
1 -
 2
2 -
 3
3 -
 4
4 -
 5
5 -
 6
6 -
 7
7 -
 8
8 -
 9
9 -
 10
10 -
 11
11 -
 12
12 -
 13
13 -
14
-
15
-
16
-
17
-
18
-
19
-
20
-
21
-
22
-
23
-
24
-
25
-
26
-
27
-
28
-
29
-
30
-
31
-
32
-
33
-
34
-
35
-
36
-
37
-
38
-
39
-
40
-
41
-
42
-
43
-
44
-
45
-
46
-
47
-
48
 |
 |
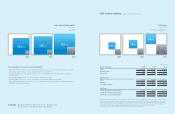
2010 Financial Summary Samsung Electronics and Consolidated Subsidiaries
CASH FLOWS
(in billions of KRW)
Cash Flows from Operating Activities
Cash Flows from Investing Activities
201020092008
(23,985)(14,177)(13,128)
23,827
18,522
13,360
Income Statements 2008 2009 2010
Sales 121,294 136,324 154,630
Operating Profit 6,032 10,925 17,297
Net Income 5,526 9,761 16,147
Balance Sheets
Assets 105,301 112,180 134,289
Liabilities 42,377 39,135 44,940
Shareholders’ Equity 62,924 73,045 89,349
Cash Flows
Cash Flows from Operating Activities 13,360 18,522 23,827
Cash Flows from Investing Activities (13,128) (14,177) (23,985)
Cash Flows from Financing Activities 1,934 (1,364) (152)
(in billions of KRW)
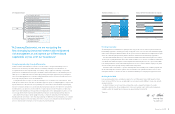
This annual report includes forward- looking statements that relate to future events and can be generally identified by phrases containing words such as “believes,”
“expects,” “anticipates,” “foresees,” “forecasts,” “estimates” or other words or phrases of similar meaning. These forward- looking statements are not guarantees
of future performance and may involve known and unknown risks, uncertainties and other factors that may affect our actual results, performance, achievements
or financial position, making them materially different from the actual future results, performance, achievements or financial position expressed or implied by these
forward- looking statements. Unless otherwise specified, all data presented in this report is from our consolidated financial statements.
※ 2008 data is based on K- GAAP standards while 2009 and 2010 data are based on K- IFRS standards.
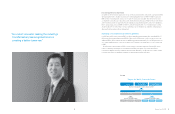
2010 Samsung Electronics Financial and Strategic Highlights
-
Achieved sales of KRW 155 trillion and operating profit of KRW 17 trillion, increases of 13% in sales and 58% in operating profit over 2009
- Demonstrated continuous increases in sales, operating profit and net income growth ratios
- Maintained sound financial structure with 50.3% liability ratio, 66.5% capital adequacy ratio and 18.0% return on equity ratio on a
consolidated basis
- Recorded KRW 949,000 stock price as of the end of 2010, a 19% increase over 2009
- Paid KRW 10,000 per share, a 25% increase over 2009, and elevated the interim dividend to KRW 5,000
- Estimated global brand value at USD 19.5 billion, up 11% over 2009. Currently ranked 19th among the top 100 global brands in the
2010
BusinessWeek
and Interbrand survey
SALES AND OPERATING PROFIT
(in billions of KRW)
Sales
Operating Profit
20092008 2010
154,630
136,324
121,294
01 2010 Financial Summary 02 Message from the CEO 06 About the Board
08 Business Overview 27 Financial Statements 88 Global Network
Contents
10,925 17,297
6,032