Samsung 2010 Annual Report Download - page 43
Download and view the complete annual report
Please find page 43 of the 2010 Samsung annual report below. You can navigate through the pages in the report by either clicking on the pages listed below, or by using the keyword search tool below to find specific information within the annual report.
82
83
NOTES TO THE CONSOLIDATED FINANCIAL STATEMENTS
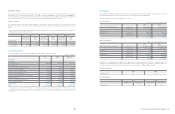
(2) Credit risk
Credit risk arises during the normal course of transactions and investing activities, where clients or other party fails to discharge an
obligation. The Company monitors and sets the counterparty’s credit limit on a periodic basis based on the counterparty’s financial
conditions, default history and other important factors.
There were no significant loans or other receivables which are overdue or subject to impairment, included in accounts receivables or other
financial instruments. The Company has evaluated there is no indication of default by any of its counterparties.
Credit risk arises from cash and cash equivalents, savings and derivative instruments transactions with financial institutions. To minimize
such risk, the Company transacts only with banks which have strong international credit rating (S&P A above), and all new transactions with
financial institutions with no prior transaction history are approved, managed and monitored by the Company’s finance team and the local
financial center. The Company requires separate approval procedure for contracts with restrictions.
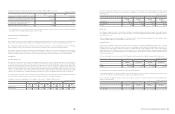
The top five customers account for approximately occupies 14.3% and 14.2% and 2,734,014 million and 2,527,089 million for the year
ended 2010 and 2009, respectively, while the top three credit exposures by country amounted to 15.6%, 12.0% and 11.0% (December 31,
2009: 13.4%, 13.4% and 11.1%), respectively.
(3) Liquidity risk
The Company manages its liquidity risk to maintain adequate net working capital by constantly managing projected cash flows. Beyond
effective working capital and cash management, the Company mitigates liquidity risk by contracting with financial institutions with respect
to bank overdrafts, Cash Pooling or Banking Facility agreement for efficient management of funds. Cash Pooling program allows sharing of
funds among subsidiaries to minimize liquidity risk and reduce financial expense.
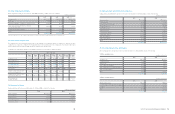
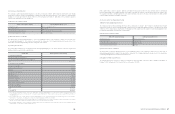
The following table below is an undiscounted cash flow analysis for financial liabilities that are presented on the balance sheet according to
their remaining contractual maturity.
Year ended December 31, 2010
Year ended December 31, 2009
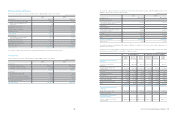
(4) Capital risk management
The object of capital management is to maintain sound capital structure. Consistent with others in the industry, the Company monitors
capital on the basis of the debt to equity ratio. This ratio is calculated as total liabilities divided by equity based on the consolidated financial
statements.
During 2010, the Company’s strategy was to maintain a reliable credit rating. The Company has maintained an A credit rating for long term
debt from S&P and A1 from Moody’s, respectively throughout the period. The gearing ratios at 31 December 2010 and 2009 were as
follows:
(In millions of Korean Won)
Less than
3 months
4-6
months
7-12
months
1-2
years
More than
2 years
Financial liabilities
₩
30,303,459
₩
245,863
₩
2,409,404
₩
623,227
₩
2,403,727
Less than
3 months
4-6
months
7-12
months
1-2
years
More than
2 years
Financial liabilities
₩
23,714,278
₩
231,348
₩
3,226,914
₩
1,279,017
₩
2,553,339
2010 2009
Total liabilities
₩
44,939,653
₩
39,134,587
Total equity 89,349,091 73,045,202
Gearing ratio 50.3% 53.6%
(In millions of Korean Won)
31. Segment Information
The chief operating decision maker has been identified as the Management Committee. The Management Committee is responsible for
making strategic decisions based on review of the group’s internal reporting. The management committee has determined the operating
segments based on these reports.
The Management Committee reviews operating profit of each operating segment in order to assess performance and make decisions about
resources to be allocated to the segment.
The operating segments are product based and include Digital media, Telecommunication, Semiconductor, LCD and others.
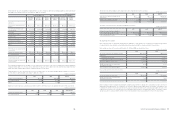
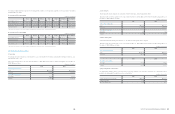
The segment information provided to the Management committee for the reportable segments for the year ended 31 December 2010 and
2009 is as follows:
1) Year ended 31 December 2010
2) Year ended 31 December 2009
Set 2010 Summary of business
by segment device
Others Elimination Consolidated
Total Digital
Media
Tele-
Communication Total Semiconductor LCD
Total segment
revenue
₩
214,945,026
₩
132,443,114
₩
81,502,962
₩
134,384,718
₩
72,806,264
₩
62,162,133
₩
12,768,940
₩
(207,468,356)
₩
154,630,328
Inter-segment
revenue (115,898,073) (75,185,552) (40,303,412) (67,546,082) (35,167,480) (32,242,249) (24,024,201) 207,468,356 -
Revenue
from external
customers
99,046,953 57,257,562 41,199,550 66,838,636 37,638,784 29,919,884 (11,255,261) - 154,630,328
Operating
profit14,822,401 486,182 4,302,554 12,089,126 10,110,698 1,991,990 385,009 - 17,296,536
Total assets
₩
89,076,990
₩
43,515,660
₩
34,365,368
₩
88,118,185
₩
55,583,214
₩
31,547,027
₩
12,360,932
₩
(55,267,363)
₩
134,288,744
Set 2009 Summary of business
by segment device
Others Elimination Consolidated
Total Digital
Media
Tele-
Communication Total Semiconductor LCD
Total segment
revenue
₩
207,745,409
₩
114,328,769
₩
72,748,628
₩
110,092,134
₩
54,813,121
₩
55,279,013
₩
2,672,165
₩
(184,186,038)
₩
136,323,670
Inter-segment
revenue (116,486,918) (63,066,694) (35,157,318) (57,447,689) (28,005,498) (29,442,191) (10,251,431) 184,186,038 -
Revenue
from external
customers
91,258,491 51,262,075 37,591,310 52,644,445 26,807,623 25,836,822 (7,579,266) - 136,323,670
Operating
profit17,162,479 3,059,935 4,091,052 3,602,445 2,058,733 1,707,433 160,335 - 10,925,259
Total assets
₩
78,804,810
₩
42,605,421
₩
31,882,983
₩
76,543,625
₩
45,458,634
₩
30,959,630
₩
7,845,175
₩
(51,013,821)
₩
112,179,789
(In millions of Korean Won)
(In millions of Korean Won)
1 Operating profit for each segment is inclusive of all consolidation eliminations.
1 Operating profit for each segment is inclusive of all consolidation eliminations.
(In millions of Korean Won)


