Samsung 2010 Annual Report Download - page 42
Download and view the complete annual report
Please find page 42 of the 2010 Samsung annual report below. You can navigate through the pages in the report by either clicking on the pages listed below, or by using the keyword search tool below to find specific information within the annual report.-
 1
1 -
2
-
3
-
4
-
5
-
6
-
7
-
8
-
9
-
10
-
11
-
12
-
13
-
14
-
15
-
16
-
17
-
18
-
19
-
20
-
21
-
22
-
23
-
24
-
25
-
26
-
27
-
28
-
29
-
30
-
31
-
 32
32 -
 33
33 -
 34
34 -
 35
35 -
 36
36 -
 37
37 -
 38
38 -
 39
39 -
 40
40 -
 41
41 -
 42
42 -
 43
43 -
 44
44 -
 45
45 -
 46
46 -
 47
47 -
 48
48
 |
 |

80 81
NOTES TO THE CONSOLIDATED FINANCIAL STATEMENTS
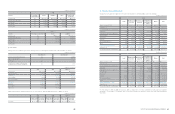
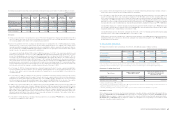
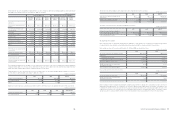
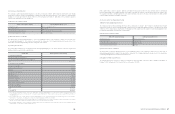
b. Significant transactions not affecting cash flows for the years ended, 2010 and 2009, are as follows:
c. The company reported on a net basis cash receipts and payments arising from transactions occurring frequently and financial
instruments, loans, borrowings which maturity in less than 3 months.
30. Financial Risk Management
Financial risk factors
The Company is exposed to credit risk, liquidity risk and market risk. Market risk arises from currency risk, interest rate risk and fair value
risk associated with investments. The Company has a risk management program in place to monitor and actively manage such risks.
Also, financial risk management officers are dispatched to the regional head quarters of each area including United States of America,
England, Singapore, China, Japan, and Brazil to run and operate a local financial center for global financial risk management.
The Company’s financial assets that are under financial risk management are composed of cash and cash equivalents, short-term financial
instruments, available-for-sale financial assets, trade and other receivables and other financial assets. The Company’s financial liabilities
under financial risk management are composed of trade and other payables, borrowings and debentures and other financial liabilities.
(1) Market risk
(a) Foreign exchange risk
The Company is exposed to foreign exchange risk arising from various currency exposures, primarily with respect to the United States
of America, European Union, Japan, other Asian countries and South America. Revenues and expenses arise from foreign currency
transactions and exchange positions, and the most widely used currencies are the US Dollar, EU’s EURO, Japanese Yen and Chinese Yuan.
Foreign exchange risk management of the Company is carried out by both SEC and its subsidiaries. To minimize foreign exchange risk
arising from operating activities, the Company’s foreign exchange management policy requires all normal business transactions to be in local
currency, or cash-in currency be matched up with cash-out currency. The Company’s foreign risk management policy also defines foreign
exchange risk, measuring period, controlling responsibilities, management procedures, hedging period and hedge ratio very specifically.
The Company limits all speculative foreign exchange transactions and operates a system to manage receivables and payables denominated
in foreign currency. It evaluates, manages and reports foreign currency exposures to receivables and payables.
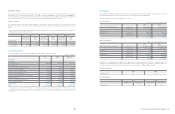
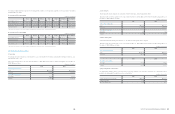
A summary of foreign assets and liabilities of the Company as of December 31, 2009 and 2010 is as follows:
2010 2009
USD EUR JPY Other USD EUR JPY Other
Financial assets 2,489,727 210,014 5,286 210,501 2,824,738 243,906 14,712 228,157
Financial liabilities 2,323,562 205,674 120,991 72,043 2,587,024 196,341 36,759 49,287
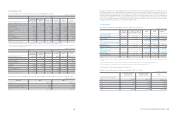
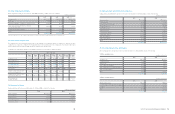
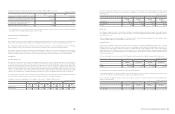
The effect of foreign currency risk to net income is a sum of net foreign currency fluctuations of Korean Won against other foreign currency
fluctuations. Foreign currency exposure to financial assets and liabilities of a 5% currency rate change against the Korean Won are
presented below.
(b) Price risk
The Company’s investment portfolio consists of direct and indirect investments in listed and non-listed securities. The market values for
the Company’s equity investments for the year-ended December 31, 2010 and 2009 are
₩
2,990,441 million and
₩
1,458,642 million
respectively. Refer to Note 7.
If there is change in price of equity investment by 1%, the amount of other comprehensive income changes for the year-ended December
31, 2010 and 2009 are
₩
26,641 million and
₩
12,297 million, respectively.
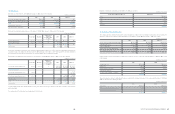
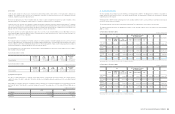
(c) Interest rate risk
Interest rate risk is defined as the risk that the fair value or future cash flows of a financial instrument will fluctuate because of changes
in market interest rates. The Company is exposed to interest rate risk mainly arising through interest bearing liabilities and assets. The
Company’s position with regard to interest rate risk exposure is mainly driven by its debt obligations such as bonds, interest-bearing
deposits and issuance of receivables. In order to avoid interest rate risk, the Company maintains minimum external borrowing by facilitating
cash pooling systems on a regional and global basis. The Company manages exposed interest rate risk via periodic monitoring and handles
risk factors on a timely basis.
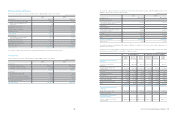
As at the reporting date, the interest rate profile of the Company’s interest bearing assets and liabilities is presented in the table below:
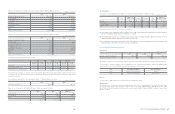
The sensitivity risk of the Company is determined based the following assumptions:
- When financial instruments are evaluated changes to profit and net equity as a result of changes in market interest rates which impact
interest income (expense) to financial instruments are evaluated using floating interest rates.
Based on the above assumption, changes to profit and net equity as a result of 1% increases in interest rate on borrowings in foreign
currency are presented below.
2010 2009
Increase Decrease Increase Decrease
Financial assets
₩
-
₩
-
₩
-
₩
-
Financial liabilities (49,693) 49,693 (41,429) 41,429
2010 2009
Increase in gain on valuation of available-for-sale securities
₩
1.193,297
₩
143,637
Reclassification of construction-in-progress and machinery-
in-transit to other property, plant and equipment accounts 14,351,744 8,850,888
Increase in share of associates and joint ventures
accumulated other comprehensive income 387,457 49,879
Net assets acquired in business combination 1,043,554 -
(In millions of Korean Won)
(In millions of Korean Won)
(In millions of Korean Won)
2010 2009
Increase Decrease Increase Decrease
Financial assets
₩
145,776
₩
(145,776)
₩
165,576
₩
(165,576)
Financial liabilities (136,113) 136,113 (143,471) 143,471
Net effect 9,663 (9,663) 22,105 (22,105)
2010 2009
Fixed rate Floating rate Fixed rate Floating rate
Assets
₩
48,532,894
₩
-
₩
43,590,557
₩
-
Liabilities 30,742,720 4,969,320 26,587,896 4,142,908
(In millions of Korean Won)
(In millions of Korean Won)