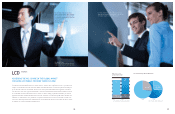
Samsung 2010 Annual Report Download - page 17
Download and view the complete annual report
Please find page 17 of the 2010 Samsung annual report below. You can navigate through the pages in the report by either clicking on the pages listed below, or by using the keyword search tool below to find specific information within the annual report.-
 1
1 -
2
-
3
-
4
-
5
-
6
-
 7
7 -
 8
8 -
 9
9 -
 10
10 -
 11
11 -
 12
12 -
 13
13 -
 14
14 -
 15
15 -
 16
16 -
 17
17 -
 18
18 -
 19
19 -
 20
20 -
 21
21 -
 22
22 -
 23
23 -
 24
24 -
 25
25 -
 26
26 -
 27
27 -
28
-
29
-
30
-
31
-
32
-
33
-
34
-
35
-
36
-
37
-
38
-
39
-
40
-
41
-
42
-
43
-
44
-
45
-
46
-
47
-
48
 |
 |
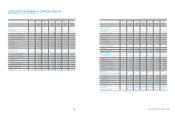
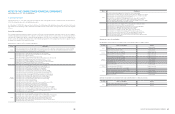
30 31
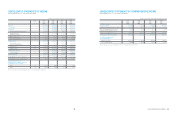
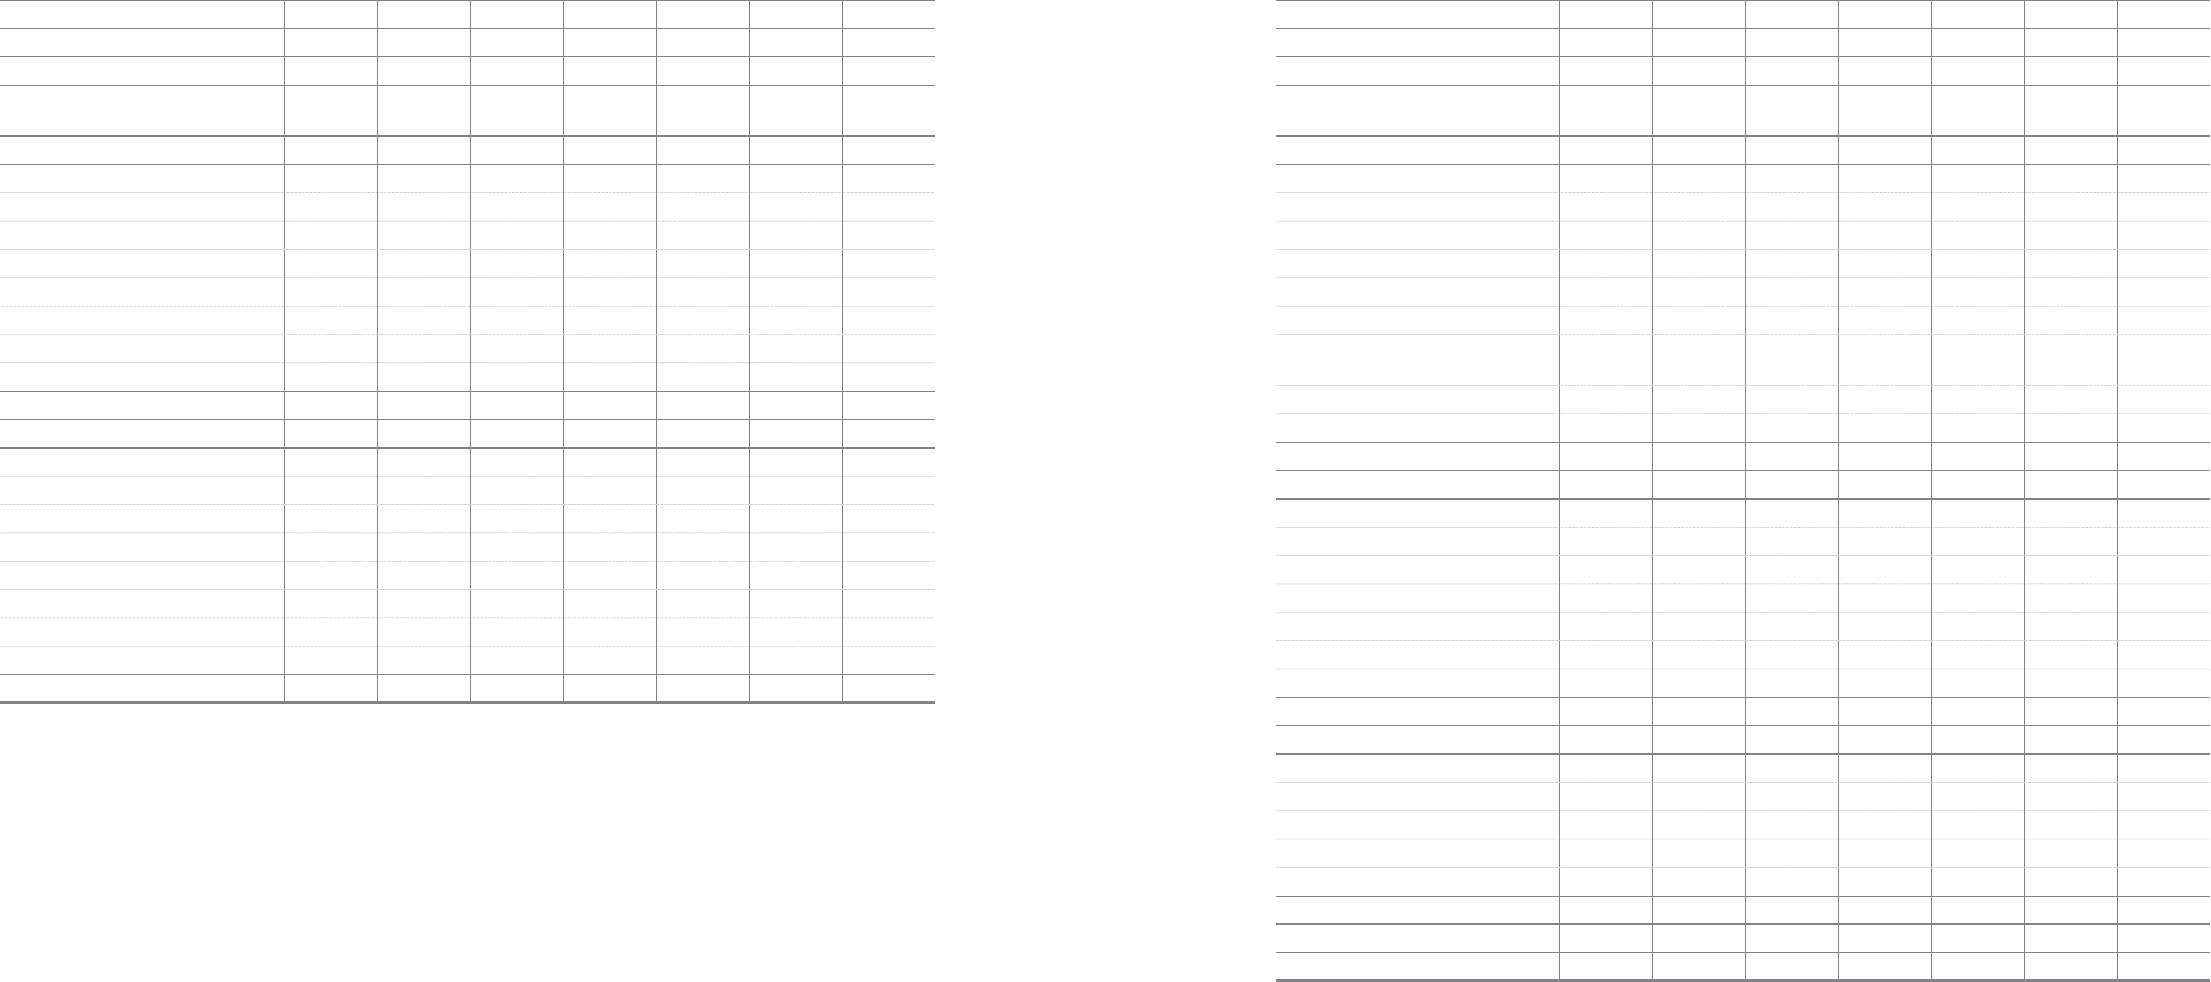
CONSOLIDATED FINANCIAL STATEMENTS
(In millions of Korean Won, in thousands of U.S dollars (Note 2.25 ))
CONSOLIDATED STATEMENTS OF FINANCIAL POSITION
Samsung Electronics Co., Ltd. and its subsidiaries
(In millions of Korean Won, in thousands of U.S dollars (Note 2.25 ))
Notes December December January December December January
2010 2009 2009 2010 2009 2009
KRW KRW KRW USD USD USD
Assets
Current assets
Cash and cash equivalents 4 9,791,419 10,149,930 6,904,366 8,597,260 8,912,047 6,062,311
Short-term financial instruments 6 11,529,392 8,629,113 3,575,942 10,123,270 7,576,708 3,139,821
Available-for-sale financial assets 7 1,159,152 2,104,420 982,067 1,017,782 1,847,765 862,294
Trade and other receivables 8 21,308,834 19,796,779 15,366,544 18,710,013 17,382,368 13,492,444
Advances 1,302,428 1,566,921 1,328,232 1,143,584 1,375,820 1,166,241
Prepaid expenses 2,200,739 1,460,449 1,883,759 1,932,337 1,282,333 1,654,016
Inventories 9 13,364,524 9,839,329 9,398,075 11,734,590 8,639,327 8,251,888
Other current assets 746,101 664,356 671,104 655,106 583,331 589,256
Total current assets 61,402,589 54,211,297 40,110,089 53,913,942 47,599,699 35,218,271
Non-current assets
Available-for-sale financial assets 7 3,040,206 1,489,138 1,268,935 2,669,423 1,307,523 1,114,176
Associates and joint ventures 10 8,335,290 7,334,705 5,912,930 7,318,720 6,440,166 5,191,790
Property, plant and equipment 11 52,964,594 43,560,295 46,276,757 46,505,043 38,247,691 40,632,854
Intangible assets 12 2,779,439 1,256,008 1,088,072 2,440,459 1,102,826 955,371
Deposits 655,662 582,148 604,874 575,698 511,149 531,104
Long-term prepaid expenses 3,544,572 2,440,608 404,501 3,112,277 2,142,952 355,168
Deferred income tax assets 1,124,009 1,051,601 905,617 986,925 923,348 795,168
Other non-current assets 442,383 253,989 206,824 388,431 223,012 181,600
Total assets 134,288,744 112,179,789 96,778,599 117,910,918 98,498,366 84,975,502
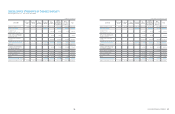
Notes December December January December December January
2010 2009 2009 2010 2009 2009
KRW KRW KRW USD USD USD
Liabilities and Equity
Current liabilities
Trade and other payables 16,049,800 13,542,626 10,123,749 14,092,370 11,890,970 8,889,059
Short-term borrowings 8,429,721 7,780,007 9,054,543 7,401,634 6,831,159 7,950,253
Advance received 883,585 1,283,314 710,353 775,823 1,126,801 623,719
Withholdings 1,052,555 844,918 551,262 924,186 741,872 484,030
Accrued expenses 7,102,427 5,945,348 5,140,938 6,236,217 5,220,255 4,513,950
Income tax payable 2,051,452 1,124,423 676,717 1,801,257 987,289 594,185
Current portion of long-term
borrowings and debentures 13,14 1,123,934 234,327 20,449 986,859 205,749 17,955
Provisions 2,917,919 3,205,865 2,829,711 2,562,050 2,814,878 2,484,600
Other current liabilities 333,328 243,596 228,095 292,675 213,887 200,276
Total current liabilities 39,944,721 34,204,424 29,335,817 35,073,071 30,032,860 25,758,027
Non-current liabilities
Long-term trade and other payables 1,072,661 1,120,982 674,119 941,839 984,267 591,904
Debentures 14 587,338 224,183 171,045 515,706 196,842 150,184
Long-term borrowings 13 634,381 1,156,094 969,839 557,012 1,015,097 851,558
Retirement benefit obligation 15 597,829 751,267 830,336 524,918 659,643 729,068
Deferred income tax liabilities 27 1,652,667 1,249,964 1,086,323 1,451,108 1,097,519 953,835
Provisions 16 295,356 244,443 176,887 259,334 214,631 155,314
Other non-current liabilities 154,700 183,230 73,848 135,835 160,882 64,842
Total liabilities 44,939,653 39,134,587 33,318,214 39,458,823 34,361,741 29,254,732
Equity attributable to owners of the parent
Preferred stock 18 119,467 119,467 119,467 104,897 104,897 104,897
Common stock 18 778,047 778,047 778,047 683,157 683,157 683,157
Share premium 18 4,403,893 4,403,893 4,403,893 3,866,795 3,866,795 3,866,795
Retained earnings 19 85,014,550 71,065,247 62,281,216 74,646,194 62,398,145 54,685,412
Other reserve 21 (4,726,398) (6,801,601) (6,607,692) (4,149,968) (5,972,080) (5,801,820)
Non-controlling interests 3,759,532 3,480,149 2,485,454 3,301,020 3,055,711 2,182,329
Total equity 89,349,091 73,045,202 63,460,385 78,452,095 64,136,625 55,720,770
Total liabilities and equity 134,288,744 112,179,789 96,778,599 117,910,918 98,498,366 84,975,502
The accompanying notes are an integral part of these consolidated financial statements.