Proctor and Gamble 2016 Annual Report Download - page 9
Download and view the complete annual report
Please find page 9 of the 2016 Proctor and Gamble annual report below. You can navigate through the pages in the report by either clicking on the pages listed below, or by using the keyword search tool below to find specific information within the annual report.-
 1
1 -
 2
2 -
 3
3 -
 4
4 -
 5
5 -
 6
6 -
 7
7 -
 8
8 -
 9
9 -
 10
10 -
 11
11 -
 12
12 -
 13
13 -
 14
14 -
 15
15 -
 16
16 -
 17
17 -
 18
18 -
 19
19 -
 20
20 -
21
-
22
-
23
-
24
-
25
-
26
-
27
-
28
-
29
-
30
-
31
-
32
-
33
-
34
-
35
-
36
-
37
-
38
-
39
-
40
-
41
-
42
-
43
-
44
-
45
-
46
-
47
-
48
-
49
-
50
-
51
-
52
-
53
-
54
-
55
-
56
-
57
-
58
-
59
-
60
-
61
-
62
-
63
-
64
-
65
-
66
-
67
-
68
-
69
-
70
-
71
-
72
-
73
-
74
-
75
-
76
-
77
-
78
-
79
-
80
-
81
-
82
-
83
-
84
-
85
-
86
-
87
-
88
-
89
-
90
-
91
-
92
 |
 |
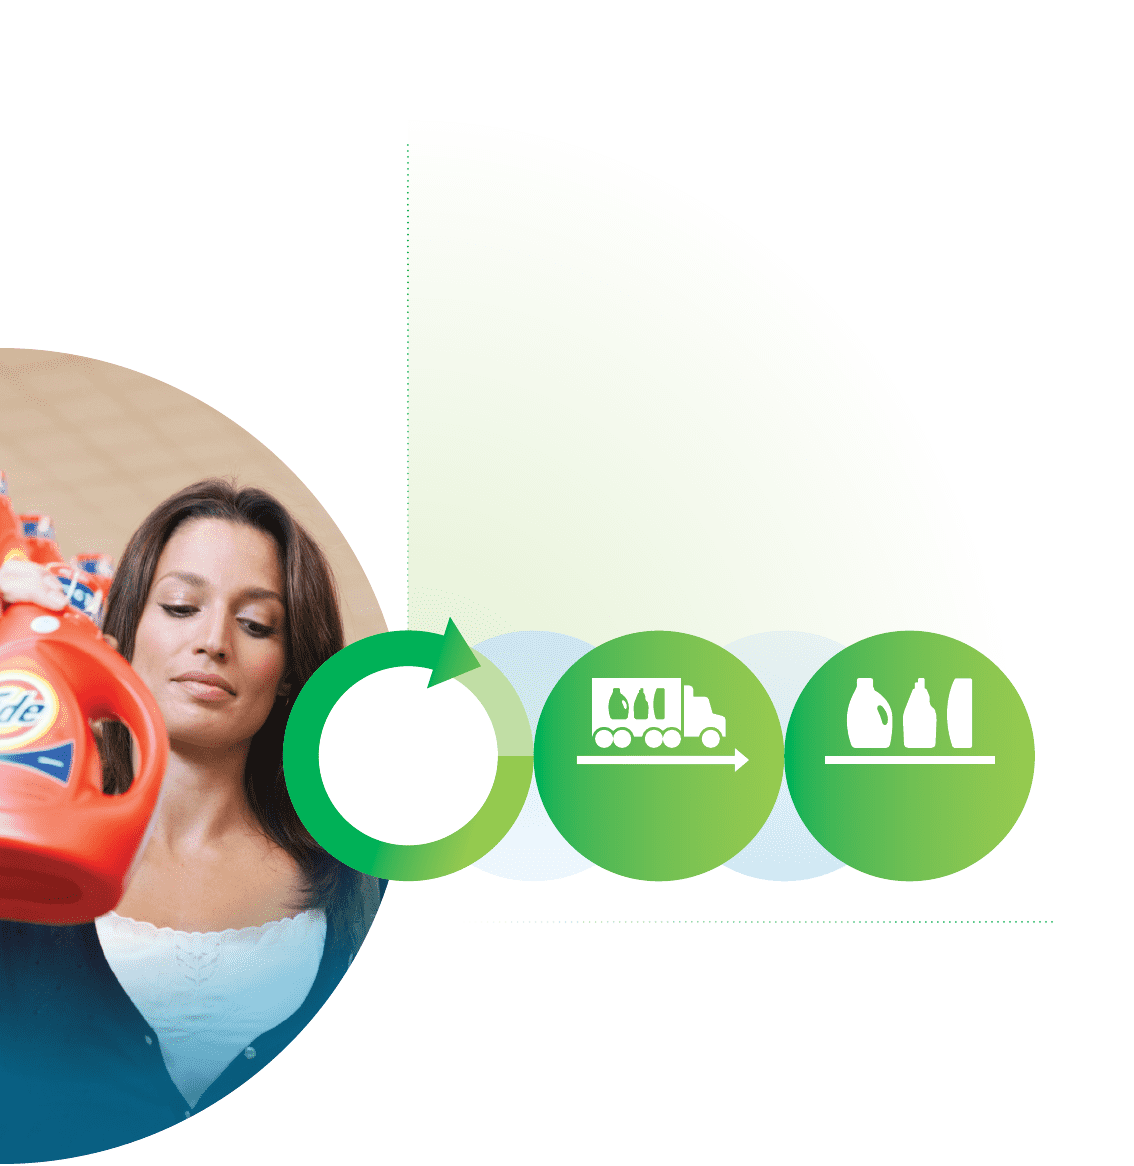
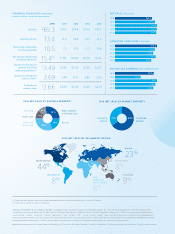
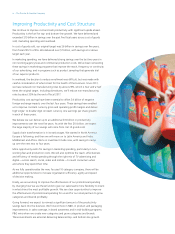
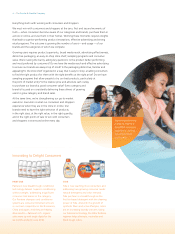
Supply Chain Efficiency
One way we’re increasing efficiency in our U.S. supply chain
is through our six new mixing centers. They are strategically
located closer to customers in key population centers, putting
80% of our U.S. business within one day of the store shelf
and the shopper. Shipping multiple categories per load
allows more efficient use of every truck and more frequent
customer deliveries. This is driving lower inventory, improving
service to retailers, and increasing product availability for
shoppers — delivering the right mix and the right amount,
right on time.
Accelerating Top-Line Growth
Sales growth is our biggest improvement need, which is enabled by winning with
consumers and fueled by both our productivity and portfolio strengthening efforts that
are underway. Our objective is to consistently deliver organic sales growth ahead of
underlying growth of the markets in which we compete. This level of top-line growth,
balanced with consistent bottom-line growth and cash generation, is what’s needed
to deliver leadership levels of value creation for P&G shareholders.
We’re making progress in accelerating organic sales growth. Organic sales for the
April–June quarter were in line or higher than the previous year in 9 of 10 product
categories. For nearly all of these businesses, the second half of the year was stronger
than the first half. Organic sales for the company were essentially flat in the first half
of the fiscal year and were up 1.5% in the second half — moving in the right direction,
but there’s more work to be done.
80%
of P&G’s U.S. business
within one day of
the store shelf multiple categories
shipped per load
increased product
availability for shoppers
The Procter & Gamble Company • v