Proctor and Gamble 2016 Annual Report Download - page 61
Download and view the complete annual report
Please find page 61 of the 2016 Proctor and Gamble annual report below. You can navigate through the pages in the report by either clicking on the pages listed below, or by using the keyword search tool below to find specific information within the annual report.-
 1
1 -
2
-
3
-
4
-
5
-
6
-
7
-
8
-
9
-
10
-
11
-
12
-
13
-
14
-
15
-
16
-
17
-
18
-
19
-
20
-
21
-
22
-
23
-
24
-
25
-
26
-
27
-
28
-
29
-
30
-
31
-
32
-
33
-
34
-
35
-
36
-
37
-
38
-
39
-
40
-
41
-
42
-
43
-
44
-
45
-
46
-
47
-
48
-
49
-
50
-
 51
51 -
 52
52 -
 53
53 -
 54
54 -
 55
55 -
 56
56 -
 57
57 -
 58
58 -
 59
59 -
 60
60 -
 61
61 -
 62
62 -
 63
63 -
 64
64 -
 65
65 -
 66
66 -
 67
67 -
 68
68 -
 69
69 -
 70
70 -
 71
71 -
72
-
73
-
74
-
75
-
76
-
77
-
78
-
79
-
80
-
81
-
82
-
83
-
84
-
85
-
86
-
87
-
88
-
89
-
90
-
91
-
92
 |
 |

The Procter & Gamble Company 47
Amounts in millions of dollars except per share amounts or as otherwise specified.
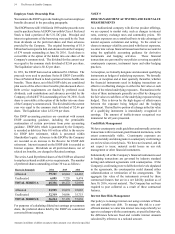
as appropriate. We have tax years open ranging from 2008 and
forward. We are generally not able to reliably estimate the
ultimate settlement amounts until the close of the audit. Based
on information currently available, we anticipate that over the
next 12 month period, audit activity could be completed related
to uncertain tax positions in multiple jurisdictions for which
we have accrued existing liabilities of approximately $250,
including interest and penalties.
Accounting pronouncements require that, without discretion,
we recognize the additional accrual of any possible related
interest and penalties relating to the underlying uncertain tax
position in income tax expense, unless the Company qualifies
for a specific exception. As of June 30, 2016, 2015 and 2014,
we had accrued interest of $323, $347 and $411 and accrued
penalties of $20, $19 and $32, respectively, which are not
included in the above table. During the fiscal years ended
June 30, 2016, 2015 and 2014, we recognized $2, $15 and $(6)
in interest benefit/(expense) and $(2), $13 and $2 in penalties
benefit/(expense), respectively. The net benefits recognized
resulted primarily from the favorable resolution of tax
positions for prior years.
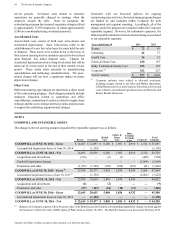
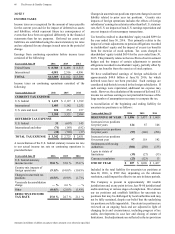
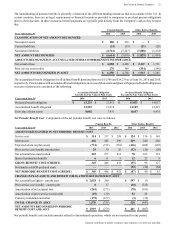
Deferred income tax assets and liabilities were comprised of
the following:
Years ended June 30 2016 2015
DEFERRED TAX ASSETS
Pension and postretirement benefits $ 2,226 $ 1,739
Loss and other carryforwards 1,077 1,014
Stock-based compensation 845 949
Advance payments 515 281
Accrued marketing and promotion 240 266
Unrealized loss on financial and
foreign exchange transactions 122 183
Fixed assets 216 139
Inventory 61 49
Accrued interest and taxes 55 48
Other 764 839
Valuation allowances (467) (324)
TOTAL $ 5,654 $ 5,183
DEFERRED TAX LIABILITIES
Goodwill and other intangible
assets $ 9,461 $ 9,530
Fixed assets 1,533 1,590
Unrealized gain on financial and
foreign exchange transactions 387 353
Other 105 149
TOTAL $ 11,486 $ 11,622
Net operating loss carryforwards were $3.2 billion and $3.1
billion at June 30, 2016 and 2015, respectively. If unused, $1.0
billion will expire between 2016 and 2035. The remainder,
totaling $2.2 billion at June 30, 2016, may be carried forward
indefinitely.