Proctor and Gamble 2016 Annual Report Download - page 60
Download and view the complete annual report
Please find page 60 of the 2016 Proctor and Gamble annual report below. You can navigate through the pages in the report by either clicking on the pages listed below, or by using the keyword search tool below to find specific information within the annual report.-
 1
1 -
2
-
3
-
4
-
5
-
6
-
7
-
8
-
9
-
10
-
11
-
12
-
13
-
14
-
15
-
16
-
17
-
18
-
19
-
20
-
21
-
22
-
23
-
24
-
25
-
26
-
27
-
28
-
29
-
30
-
31
-
32
-
33
-
34
-
35
-
36
-
37
-
38
-
39
-
40
-
41
-
42
-
43
-
44
-
45
-
46
-
47
-
48
-
49
-
 50
50 -
 51
51 -
 52
52 -
 53
53 -
 54
54 -
 55
55 -
 56
56 -
 57
57 -
 58
58 -
 59
59 -
 60
60 -
 61
61 -
 62
62 -
 63
63 -
 64
64 -
 65
65 -
 66
66 -
 67
67 -
 68
68 -
 69
69 -
 70
70 -
71
-
72
-
73
-
74
-
75
-
76
-
77
-
78
-
79
-
80
-
81
-
82
-
83
-
84
-
85
-
86
-
87
-
88
-
89
-
90
-
91
-
92
 |
 |

46 The Procter & Gamble Company
Amounts in millions of dollars except per share amounts or as otherwise specified.
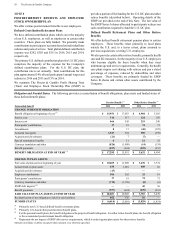
NOTE 5
INCOME TAXES
Income taxes are recognized for the amount of taxes payable
for the current year and for the impact of deferred tax assets
and liabilities, which represent future tax consequences of
events that have been recognized differently in the financial
statements than for tax purposes. Deferred tax assets and
liabilities are established using the enacted statutory tax rates
and are adjusted for any changes in such rates in the period of
change.
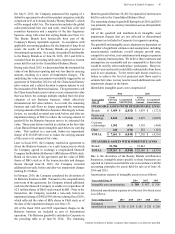
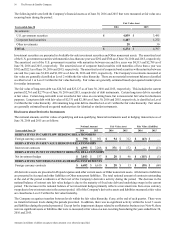
Earnings from continuing operations before income taxes
consisted of the following:
Years ended June 30 2016 2015 2014
United States $8,788 $ 8,496 $ 8,513
International 4,581 2,516 4,996
TOTAL $ 13,369 $11,012 $13,509
Income taxes on continuing operations consisted of the
following:
Years ended June 30 2016 2015 2014
CURRENT TAX EXPENSE
U.S. federal $1,673 $ 2,127 $ 1,399
International 1,483 1,142 1,252
U.S. state and local 224 252 237
3,380 3,521 2,888
DEFERRED TAX EXPENSE
U.S. federal 33 (607) 145
International and other (71) (189) (182)
(38) (796) (37)
TOTAL TAX EXPENSE $ 3,342 $ 2,725 $ 2,851
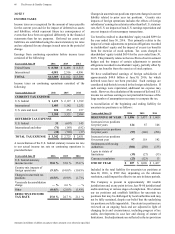
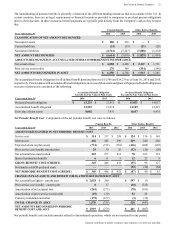
A reconciliation of the U.S. federal statutory income tax rate
to our actual income tax rate on continuing operations is
provided below:
Years ended June 30 2016 2015 2014
U.S. federal statutory
income tax rate 35.0 % 35.0 % 35.0 %
Country mix impacts of
foreign operations (9.1)% (14.0)% (10.8)%
Changes in uncertain tax
positions (0.5)% (0.9)% (1.7)%
Venezuela deconsolidation
charge —% 6.6 % — %
Other (0.4)% (2.0)% (1.4)%
EFFECTIVE INCOME
TAX RATE 25.0 % 24.7 % 21.1 %
Changes in uncertain tax positions represent changes in our net
liability related to prior year tax positions. Country mix
impacts of foreign operations includes the effects of foreign
subsidiaries' earnings taxed at rates other than the U.S. statutory
rate, the U.S. tax impacts of non-U.S. earnings repatriation and
any net impacts of intercompany transactions.
Tax benefits credited to shareholders' equity totaled $899 for
the year ended June 30, 2016. This primarily relates to the
impact of certain adjustments to pension obligations recorded
in stockholders' equity and the impact of excess tax benefits
from the exercise of stock options. Tax costs charged to
shareholders' equity totaled $634 for the year ended June 30,
2015. This primarily relates to the tax effects of net investment
hedges and the impact of certain adjustments to pension
obligations recorded in stockholders' equity, partially offset by
excess tax benefits from the exercise of stock options.
We have undistributed earnings of foreign subsidiaries of
approximately $49.0 billion at June 30, 2016, for which
deferred taxes have not been provided. Such earnings are
considered indefinitely invested in the foreign subsidiaries. If
such earnings were repatriated, additional tax expense may
result. However, the calculation of the amount of deferred U.S.
income tax on these earnings is not practicable because of the
large number of assumptions necessary to compute the tax.
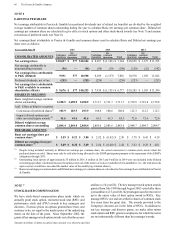
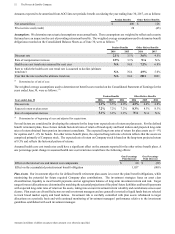
A reconciliation of the beginning and ending liability for
uncertain tax positions is as follows:
Years ended June 30 2016 2015 2014
BEGINNING OF YEAR $ 1,096 $ 1,437 $ 1,600
Increases in tax positions
for prior years 124 87 146
Decreases in tax positions
for prior years (97) (146) (296)
Increases in tax positions
for current year 97 118 142
Settlements with taxing
authorities (301) (250) (135)
Lapse in statute of
limitations (39) (27) (33)
Currency translation (23) (123) 13
END OF YEAR $ 857 $ 1,096 $ 1,437
Included in the total liability for uncertain tax positions at
June 30, 2016, is $589 that, depending on the ultimate
resolution, could impact the effective tax rate in future periods.
The Company is present in approximately 140 taxable
jurisdictions and, at any point in time, has 50-60 jurisdictional
audits underway at various stages of completion. We evaluate
our tax positions and establish liabilities for uncertain tax
positions that may be challenged by local authorities and may
not be fully sustained, despite our belief that the underlying
tax positions are fully supportable. Uncertain tax positions are
reviewed on an ongoing basis and are adjusted in light of
changing facts and circumstances, including progress of tax
audits, developments in case law and closing of statute of
limitations. Such adjustments are reflected in the tax provision