Proctor and Gamble 2016 Annual Report Download - page 63
Download and view the complete annual report
Please find page 63 of the 2016 Proctor and Gamble annual report below. You can navigate through the pages in the report by either clicking on the pages listed below, or by using the keyword search tool below to find specific information within the annual report.-
 1
1 -
2
-
3
-
4
-
5
-
6
-
7
-
8
-
9
-
10
-
11
-
12
-
13
-
14
-
15
-
16
-
17
-
18
-
19
-
20
-
21
-
22
-
23
-
24
-
25
-
26
-
27
-
28
-
29
-
30
-
31
-
32
-
33
-
34
-
35
-
36
-
37
-
38
-
39
-
40
-
41
-
42
-
43
-
44
-
45
-
46
-
47
-
48
-
49
-
50
-
51
-
52
-
 53
53 -
 54
54 -
 55
55 -
 56
56 -
 57
57 -
 58
58 -
 59
59 -
 60
60 -
 61
61 -
 62
62 -
 63
63 -
 64
64 -
 65
65 -
 66
66 -
 67
67 -
 68
68 -
 69
69 -
 70
70 -
 71
71 -
 72
72 -
 73
73 -
74
-
75
-
76
-
77
-
78
-
79
-
80
-
81
-
82
-
83
-
84
-
85
-
86
-
87
-
88
-
89
-
90
-
91
-
92
 |
 |

The Procter & Gamble Company 49
Amounts in millions of dollars except per share amounts or as otherwise specified.
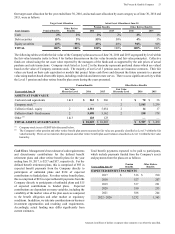
Senior-level executives receive PSU awards. Under this
program, the number of PSUs that will vest three years after
the respective grant date is based on the Company's
performance relative to pre-established performance goals
during that three year period.
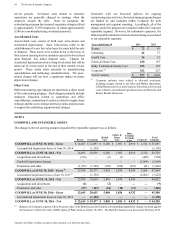
Atotal of 185 million shares of common stock were authorized
for issuance under the stock-based compensation plan
approved by shareholders in 2014. Atotal of 125 million shares
remain available for grant under the 2014 plan. The disclosures
below include stock-based compensation related to
discontinued operations, which is not material in any period
presented.
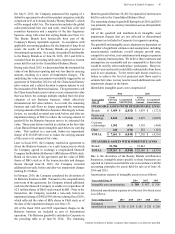
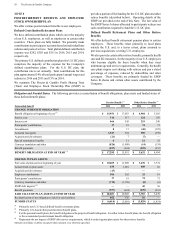
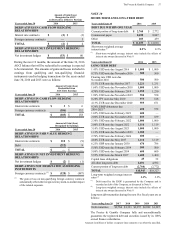
Years ended June 30 2016 2015 2014
STOCK-BASED COMPENSATION EXPENSE
Stock options $ 199 $ 223 $ 246
RSUs and PSUs 143 114 114
Income tax benefit $85
$ 109 $ 127
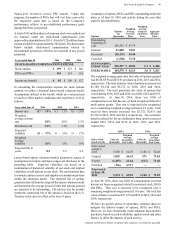
In calculating the compensation expense for stock options
granted, we utilize a binomial lattice-based valuation model.
Assumptions utilized in the model, which are evaluated and
revised to reflect market conditions and experience, were as
follows:
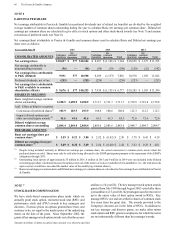
Years ended June 30
2016 2015 2014
Interest rate
0.7
-
1.9% 0.1
-
2.1% 0.1
-
2.8%
Weighted
average interest
rate 1.8% 2.0% 2.5%
Dividend yield 3.2% 3.1% 3.1%
Expected
volatility 15 -17% 11 -15% 15 -17%
Weighted
average
volatility 16% 15% 16%
Expected life in
years 8.3 8.3 8.2
Lattice-based option valuation models incorporate ranges of
assumptions for inputs and those ranges are disclosed in the
preceding table. Expected volatilities are based on a
combination of historical volatility of our stock and implied
volatilities of call options on our stock. We use historical data
to estimate option exercise and employee termination patterns
within the valuation model. The expected life of options
granted is derived from the output of the option valuation model
and represents the average period of time that options granted
are expected to be outstanding. The interest rate for periods
within the contractual life of the options is based on the U.S.
Treasury yield curve in effect at the time of grant.
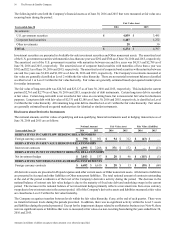
A summary of options, RSUs and PSUs outstanding under the
plans as of June 30, 2016 and activity during the year then
ended is presented below:
Options
Options
(in
thousands)
Weighted
Average
Exercise
Price
Weighted
Average
Contract-
ual Life in
Years
Aggregate
Intrinsic
Value
Outstanding,
beginning of
year 260,292 $ 63.74
Granted 21,848 79.01
Exercised (50,175) 49.40
Canceled (1,568) 73.70
OUTSTANDING,
END OF YEAR
230,397 $ 68.02 5.1 $ 3,440
EXERCISABLE
164,578 $ 62.63 3.6 $ 3,263
The weighted average grant-date fair value of options granted
was $8.48, $9.38 and $10.01 per share in 2016, 2015 and 2014,
respectively. The total intrinsic value of options exercised was
$1,388, $1,814 and $1,152 in 2016, 2015 and 2014,
respectively. The total grant-date fair value of options that
vested during 2016, 2015 and 2014 was $200, $241 and $319,
respectively. At June 30, 2016, there was $186 of
compensation cost that has not yet been recognized related to
stock option grants. That cost is expected to be recognized
over a remaining weighted average period of 1.9 years. Cash
received from options exercised was $2,332, $2,631 and
$1,938 in 2016, 2015 and 2014, respectively. The actual tax
benefit realized for the tax deductions from option exercises
totaled $433, $519 and $338 in 2016, 2015 and 2014,
respectively.
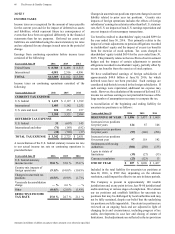
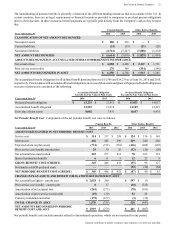
RSUs PSUs
Other stock-
based awards
Units (in
thousands)
Weighted
Average
Grant Date
Fair Value
Units (in
thousands)
Weighted
Average
Grant Date
Fair Value
Non-vested
at July 1,
2015 5,008 $ 64.78 1,188 $ 74.48
Granted 1,855 66.32 571 73.02
Vested (1,453) 61.64 (613) 71.68
Forfeited (136) 67.17 — —
Non-vested
at June 30,
2016 5,274 $ 65.53 1,146 $ 75.25
At June 30, 2016, there was $202 of compensation cost that
has not yet been recognized related to restricted stock, RSUs
and PSUs. That cost is expected to be recognized over a
remaining weighted average period of 3.0 years. The total fair
value of shares vested was $97, $79 and $95 in 2016, 2015 and
2014, respectively.
We have no specific policy to repurchase common shares to
mitigate the dilutive impact of options, RSUs and PSUs.
However, we have historically made adequate discretionary
purchases, based on cash availability, market trends and other
factors, to offset the impacts of such activity.