Proctor and Gamble 2016 Annual Report Download - page 70
Download and view the complete annual report
Please find page 70 of the 2016 Proctor and Gamble annual report below. You can navigate through the pages in the report by either clicking on the pages listed below, or by using the keyword search tool below to find specific information within the annual report.-
 1
1 -
2
-
3
-
4
-
5
-
6
-
7
-
8
-
9
-
10
-
11
-
12
-
13
-
14
-
15
-
16
-
17
-
18
-
19
-
20
-
21
-
22
-
23
-
24
-
25
-
26
-
27
-
28
-
29
-
30
-
31
-
32
-
33
-
34
-
35
-
36
-
37
-
38
-
39
-
40
-
41
-
42
-
43
-
44
-
45
-
46
-
47
-
48
-
49
-
50
-
51
-
52
-
53
-
54
-
55
-
56
-
57
-
58
-
59
-
 60
60 -
 61
61 -
 62
62 -
 63
63 -
 64
64 -
 65
65 -
 66
66 -
 67
67 -
 68
68 -
 69
69 -
 70
70 -
 71
71 -
 72
72 -
 73
73 -
 74
74 -
 75
75 -
 76
76 -
 77
77 -
 78
78 -
 79
79 -
 80
80 -
81
-
82
-
83
-
84
-
85
-
86
-
87
-
88
-
89
-
90
-
91
-
92
 |
 |

56 The Procter & Gamble Company
Amounts in millions of dollars except per share amounts or as otherwise specified.
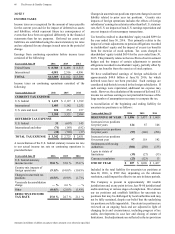
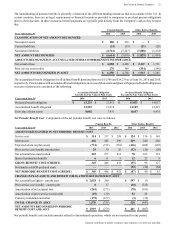
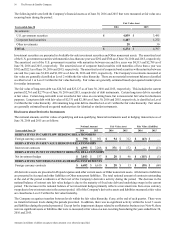
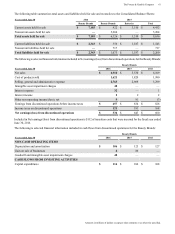
The following table sets forth the Company's financial assets as of June 30, 2016 and 2015 that were measured at fair value on a
recurring basis during the period:
Fair Value Asset
Years ended June 30 2016 2015
Investments:
U.S. government securities $ 4,839 $ 3,495
Corporate bond securities 1,407 1,272
Other investments 28 30
TOTAL $ 6,274 $ 4,797
Investment securities are presented in Available-for-sale investment securities and Other noncurrent assets. The amortized cost
of the U.S. government securities with maturities less than one year was $292 and $700 as of June 30, 2016 and 2015, respectively.
The amortized cost of the U.S. government securities with maturities between one and five years was $4,513 and $2,789 as of
June 30, 2016 and 2015, respectively. The amortized cost of corporate bond securities with maturities of less than a year was
$382 and $221 as of June 30, 2016 and 2015, respectively. The amortized cost of corporate bond securities with maturities between
one and five years was $1,018 and $1,052 as of June 30, 2016 and 2015, respectively. The Company's investments measured at
fair value are generally classified as Level 2 within the fair value hierarchy. There are no material investment balances classified
as either Level 1 or Level 3 within the fair value hierarchy. Fair values are generally estimated based upon quoted market prices
for similar instruments.
The fair value of long-term debt was $24,362 and $23,127 as of June 30, 2016 and 2015, respectively. This includes the current
portion ($2,761 and $2,776 as of June 30, 2016 and 2015, respectively) of debt instruments. Certain long-term debt is recorded
at fair value. Certain long-term debt is not recorded at fair value on a recurring basis, but is measured at fair value for disclosure
purposes. Long-term debt with fair value of $2,331 and $2,180 as of June 30, 2016 and 2015, respectively, is classified as Level
2 within the fair value hierarchy. All remaining long-term debt is classified as Level 1 within the fair value hierarchy. Fair values
are generally estimated based on quoted market prices for identical or similar instruments.
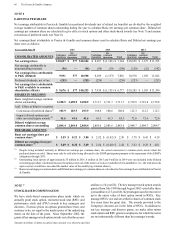
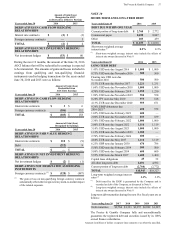
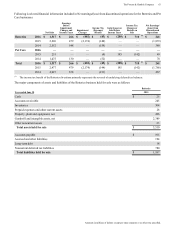
Disclosures about Derivative Instruments
The notional amounts and fair values of qualifying and non-qualifying financial instruments used in hedging transactions as of
June 30, 2016 and 2015 are as follows:
Years ended June 30
Notional Amount Fair Value Asset Fair Value (Liability)
2016 2015 2016 2015 2016 2015
DERIVATIVES IN CASH FLOW HEDGING RELATIONSHIPS
Foreign currency contracts $ 798 $ 951 $94
$ 312 $(63)$—
DERIVATIVES IN FAIR VALUE HEDGING RELATIONSHIPS
Interest rate contracts $ 4,993 $ 7,208 $ 371 $ 172 $—
$
(13)
DERIVATIVES IN NET INVESTMENT HEDGING RELATIONSHIPS
Net investment hedges $ 3,013 $ 537 $28
$96
$
(115)$(1)
DERIVATIVES NOT DESIGNATED AS HEDGING INSTRUMENTS
Foreign currency contracts $ 6,482 $ 6,610 $28
$13
$
(38)$(68)
All derivative assets are presented in Prepaid expenses and other current assets or Other noncurrent assets. All derivative liabilities
are presented in Accrued and other liabilities or Other noncurrent liabilities. The total notional amount of contracts outstanding
at the end of the period is indicative of the level of the Company's derivative activity during the period. The decrease in the
notional balance of interest rate fair value hedges is due to the maturity of fixed rate debt and underlying swaps in the current
period. The increase in the notional balance of net investment hedges primarily reflects a movement into Euro cross currency
swaps due to lower interest rates in the current period. All of the Company's derivative assets and liabilities measured at fair value
are classified as Level 2 within the fair value hierarchy.
The Company recognizes transfers between levels within the fair value hierarchy, if any, at the end of each quarter. There were
no transfers between levels during the periods presented. In addition, there was no significant activity within the Level 3 assets
and liabilities during the periods presented. Except for the impairment charges related to our Batteries business (see Note 4), there
were no significant assets or liabilities that were re-measured at fair value on a non-recurring basis during the years ended June 30,
2016 and 2015.