Proctor and Gamble 2016 Annual Report Download - page 22
Download and view the complete annual report
Please find page 22 of the 2016 Proctor and Gamble annual report below. You can navigate through the pages in the report by either clicking on the pages listed below, or by using the keyword search tool below to find specific information within the annual report.-
 1
1 -
2
-
3
-
4
-
5
-
6
-
7
-
8
-
9
-
10
-
11
-
 12
12 -
 13
13 -
 14
14 -
 15
15 -
 16
16 -
 17
17 -
 18
18 -
 19
19 -
 20
20 -
 21
21 -
 22
22 -
 23
23 -
 24
24 -
 25
25 -
 26
26 -
 27
27 -
 28
28 -
 29
29 -
 30
30 -
 31
31 -
 32
32 -
33
-
34
-
35
-
36
-
37
-
38
-
39
-
40
-
41
-
42
-
43
-
44
-
45
-
46
-
47
-
48
-
49
-
50
-
51
-
52
-
53
-
54
-
55
-
56
-
57
-
58
-
59
-
60
-
61
-
62
-
63
-
64
-
65
-
66
-
67
-
68
-
69
-
70
-
71
-
72
-
73
-
74
-
75
-
76
-
77
-
78
-
79
-
80
-
81
-
82
-
83
-
84
-
85
-
86
-
87
-
88
-
89
-
90
-
91
-
92
 |
 |
8 The Procter & Gamble Company
PART II
Item 5. Market for Registrant's Common Equity, Related Stockholder Matters and Issuer Purchases of Equity Securities.
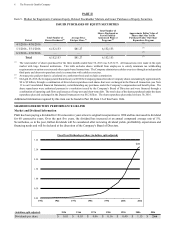
ISSUER PURCHASES OF EQUITY SECURITIES
Period
Total Number of
Shares Purchased
(1)
Average Price
Paid per Share
(2)
Total N um be r of
Shares Purchased as
Part of Publicly
Announced Plans or
Programs
(3)
Approximate Dollar Value of
Shares that May Yet Be
Purchased Under Our Share
Repurchase Program
4/1/2016 - 4/30/2016 — — —
(3)
5/1/2016 - 5/31/2016 6,152,153 $81.27 6,152,153
(3)
6/1/2016 - 6/30/2016 — — —
(3)
Total 6,152,153 $81.27 6,152,153
(3)
(1)
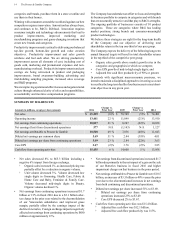
The total number of shares purchased for the three months ended June 30, 2016 was 6,152,153. All transactions were made in the open
market with large financial institutions. This table excludes shares withheld from employees to satisfy minimum tax withholding
requirements on option exercises and other equity-based transactions. The Company administers cashless exercises through an independent
third party and does not repurchase stock in connection with cashless exercises.
(2)
Average price paid per share is calculated on a settlement basis and excludes commission.
(3)
OnApril 26, 2016, the Company stated that in fiscal year 2016 the Company planned to reduce Company shares outstanding by approximately
$8 to $9 billion, through a combination of direct share repurchases and shares that were exchanged in the Duracell transaction (see Note
13 to our Consolidated Financial Statements), notwithstanding any purchases under the Company's compensation and benefit plans. The
share repurchases were authorized pursuant to a resolution issued by the Company's Board of Directors and were financed through a
combination of operating cash flows and issuance of long-term and short-term debt. The total value of the shares purchased under the share
repurchase plan and exchanged in the Duracell transaction was $8.2 billion. The share repurchase plan ended on June 30, 2016.
Additional information required by this item can be found in Part III, Item 12 of this Form 10-K.
SHAREHOLDER RETURN PERFORMANCE GRAPHS
Market and Dividend Information
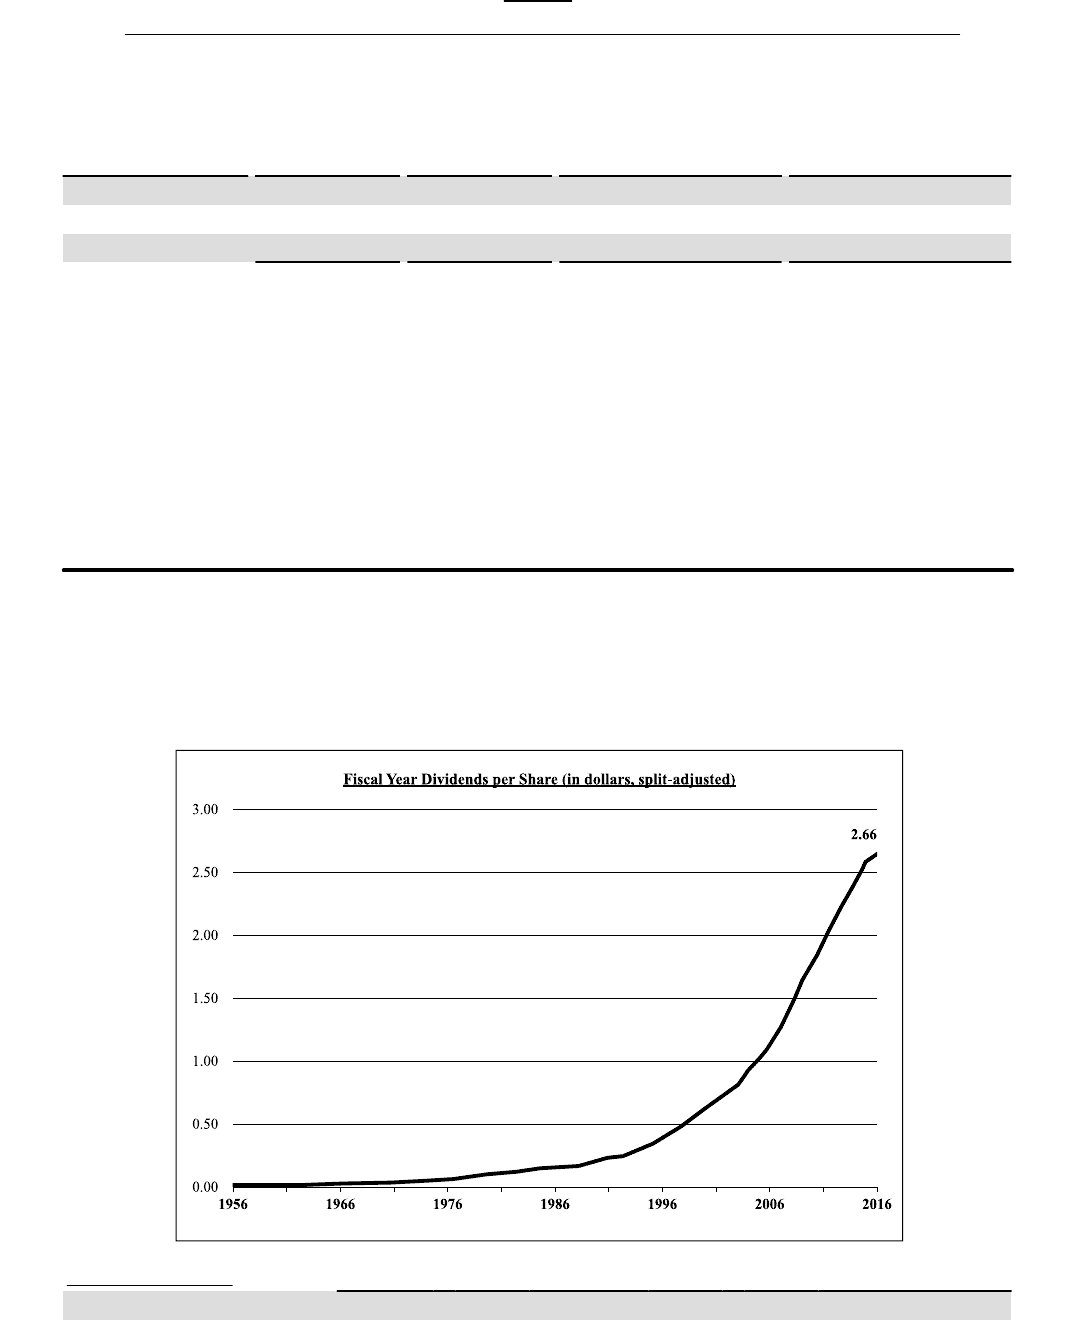
P&G has been paying a dividend for 126 consecutive years since its original incorporation in 1890 and has increased its dividend
for 60 consecutive years. Over the past five years, the dividend has increased at an annual compound average rate of 5%.
Nevertheless, as in the past, further dividends will be considered after reviewing dividend yields, profitability expectations and
financing needs and will be declared at the discretion of the Company's Board of Directors.
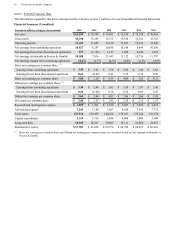
(in dollars; split-adjusted) 1956 1966 1976 1986 1996 2006 2016
Dividends per share $ 0.01 $ 0.03 $ 0.06 $ 0.16 $ 0.40 $ 1.15 $ 2.66