Proctor and Gamble 2016 Annual Report Download - page 68
Download and view the complete annual report
Please find page 68 of the 2016 Proctor and Gamble annual report below. You can navigate through the pages in the report by either clicking on the pages listed below, or by using the keyword search tool below to find specific information within the annual report.-
 1
1 -
2
-
3
-
4
-
5
-
6
-
7
-
8
-
9
-
10
-
11
-
12
-
13
-
14
-
15
-
16
-
17
-
18
-
19
-
20
-
21
-
22
-
23
-
24
-
25
-
26
-
27
-
28
-
29
-
30
-
31
-
32
-
33
-
34
-
35
-
36
-
37
-
38
-
39
-
40
-
41
-
42
-
43
-
44
-
45
-
46
-
47
-
48
-
49
-
50
-
51
-
52
-
53
-
54
-
55
-
56
-
57
-
 58
58 -
 59
59 -
 60
60 -
 61
61 -
 62
62 -
 63
63 -
 64
64 -
 65
65 -
 66
66 -
 67
67 -
 68
68 -
 69
69 -
 70
70 -
 71
71 -
 72
72 -
 73
73 -
 74
74 -
 75
75 -
 76
76 -
 77
77 -
 78
78 -
79
-
80
-
81
-
82
-
83
-
84
-
85
-
86
-
87
-
88
-
89
-
90
-
91
-
92
 |
 |

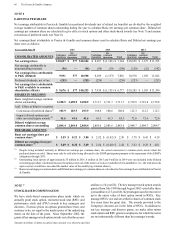
54 The Procter & Gamble Company
Amounts in millions of dollars except per share amounts or as otherwise specified.
Employee Stock Ownership Plan
We maintain the ESOPto provide funding for certain employee
benefits discussed in the preceding paragraphs.
The ESOPborrowed $1.0 billion in 1989 and the proceeds were
used to purchase Series A ESOP Convertible Class A Preferred
Stock to fund a portion of the U.S. DC plan. Principal and
interest requirements of the borrowing were paid by the Trust
from dividends on the preferred shares and from advances
provided by the Company. The original borrowing of $1.0
billion has been repaid in full, and advances from the Company
of $74 remain outstanding at June 30, 2016. Each share is
convertible at the option of the holder into one share of the
Company's common stock. The dividend for the current year
was equal to the common stock dividend of $2.66 per share.
The liquidation value is $6.82 per share.
In 1991, the ESOP borrowed an additional $1.0 billion. The
proceeds were used to purchase Series B ESOP Convertible
Class A Preferred Stock to fund a portion of retiree health care
benefits. These shares, net of the ESOP's debt, are considered
plan assets of the other retiree benefits plan discussed above.
Debt service requirements are funded by preferred stock
dividends, cash contributions and advances provided by the
Company, of which $718 is outstanding at June 30, 2016. Each
share is convertible at the option of the holder into one share
of the Company's common stock. The dividend for the current
year was equal to the common stock dividend of $2.66 per
share. The liquidation value is $12.96 per share.
Our ESOP accounting practices are consistent with current
ESOP accounting guidance, including the permissible
continuation of certain provisions from prior accounting
guidance. ESOP debt, which is guaranteed by the Company,
is recorded as debt (see Note 10) with an offset to the reserve
for ESOP debt retirement, which is presented within
Shareholders' equity. Advances to the ESOP by the Company
are recorded as an increase in the Reserve for ESOP debt
retirement. Interest incurred on the ESOP debt is recorded as
Interest expense. Dividends on all preferred shares, net of
related tax benefits, are charged to Retained earnings.
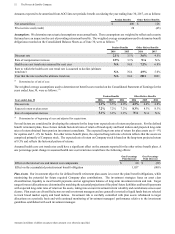
The series A and B preferred shares of the ESOP are allocated
to employees based on debt service requirements. The number
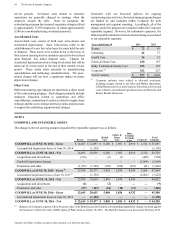
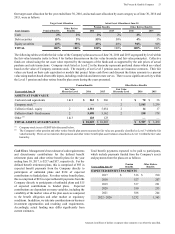
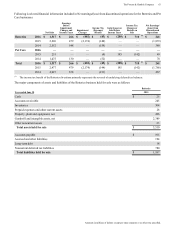
of preferred shares outstanding at June 30 was as follows:
Shares in thousands 2016 2015 2014
Allocated 39,241 42,044 44,465
Unallocated 6,095 7,228 8,474
TOTAL SERIES A 45,336 49,272 52,939
Allocated 23,925 23,074 22,085
Unallocated 32,319 34,096 35,753
TOTAL SERIES B 56,244 57,170 57,838
For purposes of calculating diluted net earnings per common
share, the preferred shares held by the ESOP are considered
converted from inception.
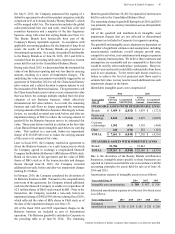
NOTE 9
RISK MANAGEMENT ACTIVITIES AND FAIR VALUE
MEASUREMENTS
As a multinational company with diverse product offerings,
we are exposed to market risks, such as changes in interest
rates, currency exchange rates and commodity prices. We
evaluate exposures on a centralized basis to take advantage of
natural exposure correlation and netting. To the extent we
choose to manage volatility associated with the net exposures,
we enter into various financial transactions that we account for
using the applicable accounting guidance for derivative
instruments and hedging activities. These financial
transactions are governed by our policies covering acceptable
counterparty exposure, instrument types and other hedging
practices.
At inception, we formally designate and document qualifying
instruments as hedges of underlying exposures. We formally
assess, at inception and at least quarterly thereafter, whether
the financial instruments used in hedging transactions are
effective at offsetting changes in either the fair value or cash
flows of the related underlying exposures. Fluctuations in the
value of these instruments generally are offset by changes in
the fair value or cash flows of the underlying exposures being
hedged. This is driven by the high degree of effectiveness
between the exposure being hedged and the hedging
instrument. The ineffective portion of a change in the fair value
of a qualifying instrument is immediately recognized in
earnings. The amount of ineffectiveness recognized was
immaterial for all years presented.
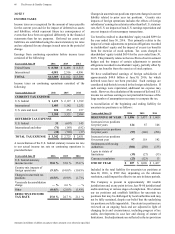
Credit Risk Management
We have counterparty credit guidelines and normally enter into
transactions with investment grade financial institutions, to the
extent commercially viable. Counterparty exposures are
monitored daily and downgrades in counterparty credit ratings
are reviewed on a timely basis. We have not incurred, and do
not expect to incur, material credit losses on our risk
management or other financial instruments.
Substantially all of the Company's financial instruments used
in hedging transactions are governed by industry standard
netting and collateral agreements with counterparties. If the
Company's credit rating were to fall below the levels stipulated
in the agreements, the counterparties could demand either
collateralization or termination of the arrangements. The
aggregate fair value of the instruments covered by these
contractual features that are in a net liability position as of
June 30, 2016, was not material. The Company has not been
required to post collateral as a result of these contractual
features.
Interest Rate Risk Management
Our policy is to manage interest cost using a mixture of fixed-
rate and variable-rate debt. To manage this risk in a cost-
efficient manner, we enter into interest rate swaps whereby we
agree to exchange with the counterparty, at specified intervals,
the difference between fixed and variable interest amounts
calculated by reference to a notional amount.