Proctor and Gamble 2016 Annual Report Download - page 4
Download and view the complete annual report
Please find page 4 of the 2016 Proctor and Gamble annual report below. You can navigate through the pages in the report by either clicking on the pages listed below, or by using the keyword search tool below to find specific information within the annual report.-
 1
1 -
 2
2 -
 3
3 -
 4
4 -
 5
5 -
 6
6 -
 7
7 -
 8
8 -
 9
9 -
 10
10 -
 11
11 -
 12
12 -
 13
13 -
 14
14 -
 15
15 -
16
-
17
-
18
-
19
-
20
-
21
-
22
-
23
-
24
-
25
-
26
-
27
-
28
-
29
-
30
-
31
-
32
-
33
-
34
-
35
-
36
-
37
-
38
-
39
-
40
-
41
-
42
-
43
-
44
-
45
-
46
-
47
-
48
-
49
-
50
-
51
-
52
-
53
-
54
-
55
-
56
-
57
-
58
-
59
-
60
-
61
-
62
-
63
-
64
-
65
-
66
-
67
-
68
-
69
-
70
-
71
-
72
-
73
-
74
-
75
-
76
-
77
-
78
-
79
-
80
-
81
-
82
-
83
-
84
-
85
-
86
-
87
-
88
-
89
-
90
-
91
-
92
 |
 |

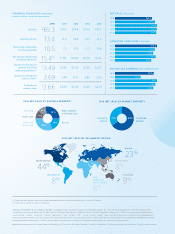
We continued to build on our strong track record of returning cash to you, our
shareholders. We paid $7.4 billion in dividends, increasing our dividend for the 60th
consecutive year. We reduced shares outstanding by more than $8 billion through
a combination of share repurchases and shares that were exchanged in the Duracell
transaction. In total, P&G delivered nearly $16 billion of value for shareholders.
We made progress in a challenging environment, but we know we need to do better.
We are focused on streamlining and strengthening our product portfolio, improving
productivity and our cost structure, building the foundation for stronger top-line
growth, and strengthening our organization and culture. These are the choices we’re
focused on to raise the bar on P&G’s performance to consistently deliver balanced
growth and leadership value creation.
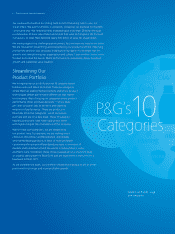
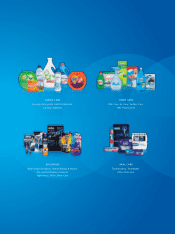
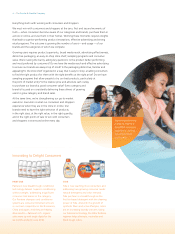
Streamlining Our
Product Portfolio
We’re organizing our portfolio around 10 category-based
business units and about 65 brands. These are categories
where P&G has leading market positions and where product
technologies deliver performance differences that matter
to consumers. We’re focusing on categories where product
performance drives purchase decisions — where there
are clear consumer jobs to be done and objective
measures of performance. These are products in
financially attractive categories, which consumers
purchase and use on a daily basis. These 10 category-
based business units have historically grown faster
with higher margins than the balance of the company.
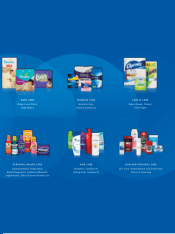
Within these core categories, we are streamlining
our product lines. For example, we are making smart
choices to discontinue undifferentiated, unprofitable
and commoditizing products in favor of more profitable,
consumer-preferred and differentiated products in a number of
markets and businesses around the world, including Mexico, India
and Fabric Care. Combined, these choices caused about a one-point drag
on organic sales growth in fiscal 2016 and are expected to continue to be a
headwind in fiscal 2017.
As we complete this work, our portfolio of brands and products will be better
positioned for stronger and more profitable growth.
10
P&G’s
Categories
Explore our brands
and categories
ii • The Procter & Gamble Company