Proctor and Gamble 2016 Annual Report Download - page 48
Download and view the complete annual report
Please find page 48 of the 2016 Proctor and Gamble annual report below. You can navigate through the pages in the report by either clicking on the pages listed below, or by using the keyword search tool below to find specific information within the annual report.-
 1
1 -
2
-
3
-
4
-
5
-
6
-
7
-
8
-
9
-
10
-
11
-
12
-
13
-
14
-
15
-
16
-
17
-
18
-
19
-
20
-
21
-
22
-
23
-
24
-
25
-
26
-
27
-
28
-
29
-
30
-
31
-
32
-
33
-
34
-
35
-
36
-
37
-
 38
38 -
 39
39 -
 40
40 -
 41
41 -
 42
42 -
 43
43 -
 44
44 -
 45
45 -
 46
46 -
 47
47 -
 48
48 -
 49
49 -
 50
50 -
 51
51 -
 52
52 -
 53
53 -
 54
54 -
 55
55 -
 56
56 -
 57
57 -
 58
58 -
59
-
60
-
61
-
62
-
63
-
64
-
65
-
66
-
67
-
68
-
69
-
70
-
71
-
72
-
73
-
74
-
75
-
76
-
77
-
78
-
79
-
80
-
81
-
82
-
83
-
84
-
85
-
86
-
87
-
88
-
89
-
90
-
91
-
92
 |
 |

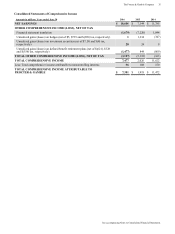
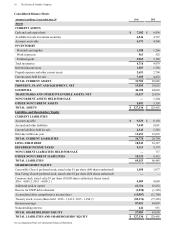
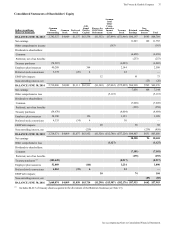
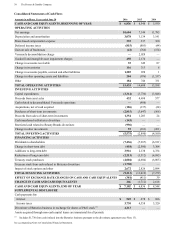
34 The Procter & Gamble Company
See accompanying Notes to Consolidated Financial Statements.
Consolidated Statements of Earnings
Amounts in millions except per share amounts; Years ended June 30 2016 2015 2014
NET SALES $ 65,299 $ 70,749 $ 74,401
Cost of products sold 32,909 37,056 39,030
Selling, general and administrative expense 18,949 20,616 21,461
Venezuela deconsolidation charge —2,028 —
OPERATING INCOME 13,441 11,049 13,910
Interest expense 579 626 709
Interest income 182 149 99
Other non-operating income, net 325 440 209
EARNINGS FROM CONTINUING OPERATIONS BEFORE INCOME TAXES 13,369 11,012 13,509
Income taxes on continuing operations 3,342 2,725 2,851
NET EARNINGS FROM CONTINUING OPERATIONS 10,027 8,287 10,658
NET EARNINGS/(LOSS) FROM DISCONTINUED OPERATIONS 577 (1,143) 1,127
NET EARNINGS 10,604 7,144 11,785
Less: Net earnings attributable to noncontrolling interests 96 108 142
NET EARNINGS ATTRIBUTABLE TO PROCTER & GAMBLE $ 10,508 $ 7,036 $ 11,643
BASIC NET EARNINGS PER COMMON SHARE:
(1)
Earnings from continuing operations $ 3.59 $ 2.92 $ 3.78
Earnings/(loss) from discontinued operations 0.21 (0.42)0.41
BASICNETEARNINGSPERCOMMONSHARE $ 3.80 $2.50$4.19
DILUTED NET EARNINGS PER COMMON SHARE:
(1)
Earnings from continuing operations $ 3.49 $ 2.84 $ 3.63
Earnings/(loss) from discontinued operations 0.20 (0.40)0.38
DILUTED NET EARNINGS PER COMMON SHARE $ 3.69 $2.44$4.01
DIVIDENDS PER COMMON SHARE $ 2.66 $2.59$2.45
(1)
Basic net earnings per common share and Diluted net earnings per common share are calculated on Net earnings attributable to Procter &
Gamble.