Proctor and Gamble 2016 Annual Report Download - page 49
Download and view the complete annual report
Please find page 49 of the 2016 Proctor and Gamble annual report below. You can navigate through the pages in the report by either clicking on the pages listed below, or by using the keyword search tool below to find specific information within the annual report.-
 1
1 -
2
-
3
-
4
-
5
-
6
-
7
-
8
-
9
-
10
-
11
-
12
-
13
-
14
-
15
-
16
-
17
-
18
-
19
-
20
-
21
-
22
-
23
-
24
-
25
-
26
-
27
-
28
-
29
-
30
-
31
-
32
-
33
-
34
-
35
-
36
-
37
-
38
-
 39
39 -
 40
40 -
 41
41 -
 42
42 -
 43
43 -
 44
44 -
 45
45 -
 46
46 -
 47
47 -
 48
48 -
 49
49 -
 50
50 -
 51
51 -
 52
52 -
 53
53 -
 54
54 -
 55
55 -
 56
56 -
 57
57 -
 58
58 -
 59
59 -
60
-
61
-
62
-
63
-
64
-
65
-
66
-
67
-
68
-
69
-
70
-
71
-
72
-
73
-
74
-
75
-
76
-
77
-
78
-
79
-
80
-
81
-
82
-
83
-
84
-
85
-
86
-
87
-
88
-
89
-
90
-
91
-
92
 |
 |

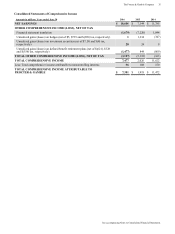
The Procter & Gamble Company 35
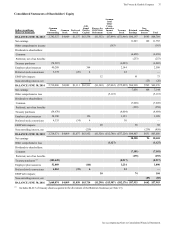
See accompanying Notes to Consolidated Financial Statements.
Consolidated Statements of Comprehensive Income
Amounts in millions; Years ended June 30 2016 2015 2014
NET EARNINGS $ 10,604 $ 7,144 $ 11,785
OTHER COMPREHENSIVE INCOME/(LOSS), NET OF TAX
Financial statement translation (1,679)(7,220) 1,044
Unrealized gains/(losses) on hedges (net of $5, $739 and $(209) tax, respectively) 11,234 (347)
Unrealized gains/(losses) on investment securities (net of $7, $0 and $(4) tax,
respectively) 28 24 9
Unrealized gains/(losses) on defined benefit retirement plans (net of $(621), $328
and $(356) tax, respectively) (1,477)844 (869)
TOTAL OTHER COMPREHENSIVE INCOME/(LOSS), NET OF TAX (3,127)(5,118)(163)
TOTAL COMPREHENSIVE INCOME 7,477 2,026 11,622
Less: Total comprehensive income attributable to noncontrolling interests 96 108 150
TOTAL COMPREHENSIVE INCOME ATTRIBUTABLE TO
PROCTER & GAMBLE $ 7,381 $ 1,918 $ 11,472