Proctor and Gamble 2016 Annual Report Download - page 78
Download and view the complete annual report
Please find page 78 of the 2016 Proctor and Gamble annual report below. You can navigate through the pages in the report by either clicking on the pages listed below, or by using the keyword search tool below to find specific information within the annual report.-
 1
1 -
2
-
3
-
4
-
5
-
6
-
7
-
8
-
9
-
10
-
11
-
12
-
13
-
14
-
15
-
16
-
17
-
18
-
19
-
20
-
21
-
22
-
23
-
24
-
25
-
26
-
27
-
28
-
29
-
30
-
31
-
32
-
33
-
34
-
35
-
36
-
37
-
38
-
39
-
40
-
41
-
42
-
43
-
44
-
45
-
46
-
47
-
48
-
49
-
50
-
51
-
52
-
53
-
54
-
55
-
56
-
57
-
58
-
59
-
60
-
61
-
62
-
63
-
64
-
65
-
66
-
67
-
 68
68 -
 69
69 -
 70
70 -
 71
71 -
 72
72 -
 73
73 -
 74
74 -
 75
75 -
 76
76 -
 77
77 -
 78
78 -
 79
79 -
 80
80 -
 81
81 -
 82
82 -
 83
83 -
 84
84 -
 85
85 -
 86
86 -
 87
87 -
 88
88 -
89
-
90
-
91
-
92
 |
 |

64 The Procter & Gamble Company
Amounts in millions of dollars except per share amounts or as otherwise specified.
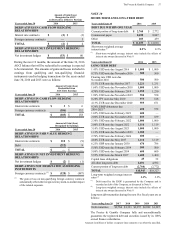
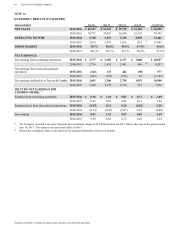
NOTE 14
QUARTERLY RESULTS (UNAUDITED)
Quarters Ended Sep 30 Dec 31 Mar 31 Jun 30 Total Year
NET SALES 2015-2016 $ 16,527 $ 16,915 $ 15,755 $ 16,102 $ 65,299
2014-2015 18,771 18,495 16,930 16,553 70,749
OPERATING INCOME 2015-2016 3,768 3,853 3,318 2,502 13,441
2014-2015 3,633 3,579 3,025 812
(1)
11,049
GROSS MARGIN 2015-2016 50.7% 50.0% 49.8% 47.9% 49.6%
2014-2015 48.1 % 48.3 % 47.3 % 46.6 % 47.6 %
NET EARNINGS:
Net earnings from continuing operations 2015-2016 $ 2,777 $ 2,905 $ 2,337 $ 2,008 $ 10,027
2014-2015 2,716 2,674 2,401 496
(1)
8,287
Net earnings/(loss) from discontinued
operations 2015-2016 (142) 323 446 (50) 577
2014-2015 (696) (276) (213) 42 (1,143)
Net earnings attributable to Procter & Gamble 2015-2016 2,601 3,206 2,750 1,951 10,508
2014-2015 1,990 2,372 2,153 521 7,036
DILUTED NET EARNINGS PER
COMMON SHARE:
(2)
Earnings from continuing operations 2015-2016 $ 0.96 $ 1.01 $ 0.81 $ 0.71 $ 3.49
2014-2015 0.93 0.92 0.82 0.17 2.84
Earnings/(loss) from discontinued operations 2015-2016 (0.05) 0.11 0.16 (0.02) 0.20
2014-2015 (0.24) (0.10) (0.07) 0.01 (0.40)
Net earnings 2015-2016 0.91 1.12 0.97 0.69 3.69
2014-2015 0.69 0.82 0.75 0.18 2.44
(1)
The Company recorded a one-time Venezuela deconsolidation charge of $2.0 billion before tax ($2.1 billion after tax) in the quarter-ended
June 30, 2015. This impact is discussed more fully in Note 1.
(2)
Diluted net earnings per share is calculated on Net earnings attributable to Procter & Gamble.